Products
Discover the reports that analyze your catalog, your sales by product and your stock, and pick the one that answers your question.
The Products section groups every report that starts from your catalog. They answer questions such as "which products earned the most this month", "which size sells best", "which brand is declining" or "how many days until this product runs out".
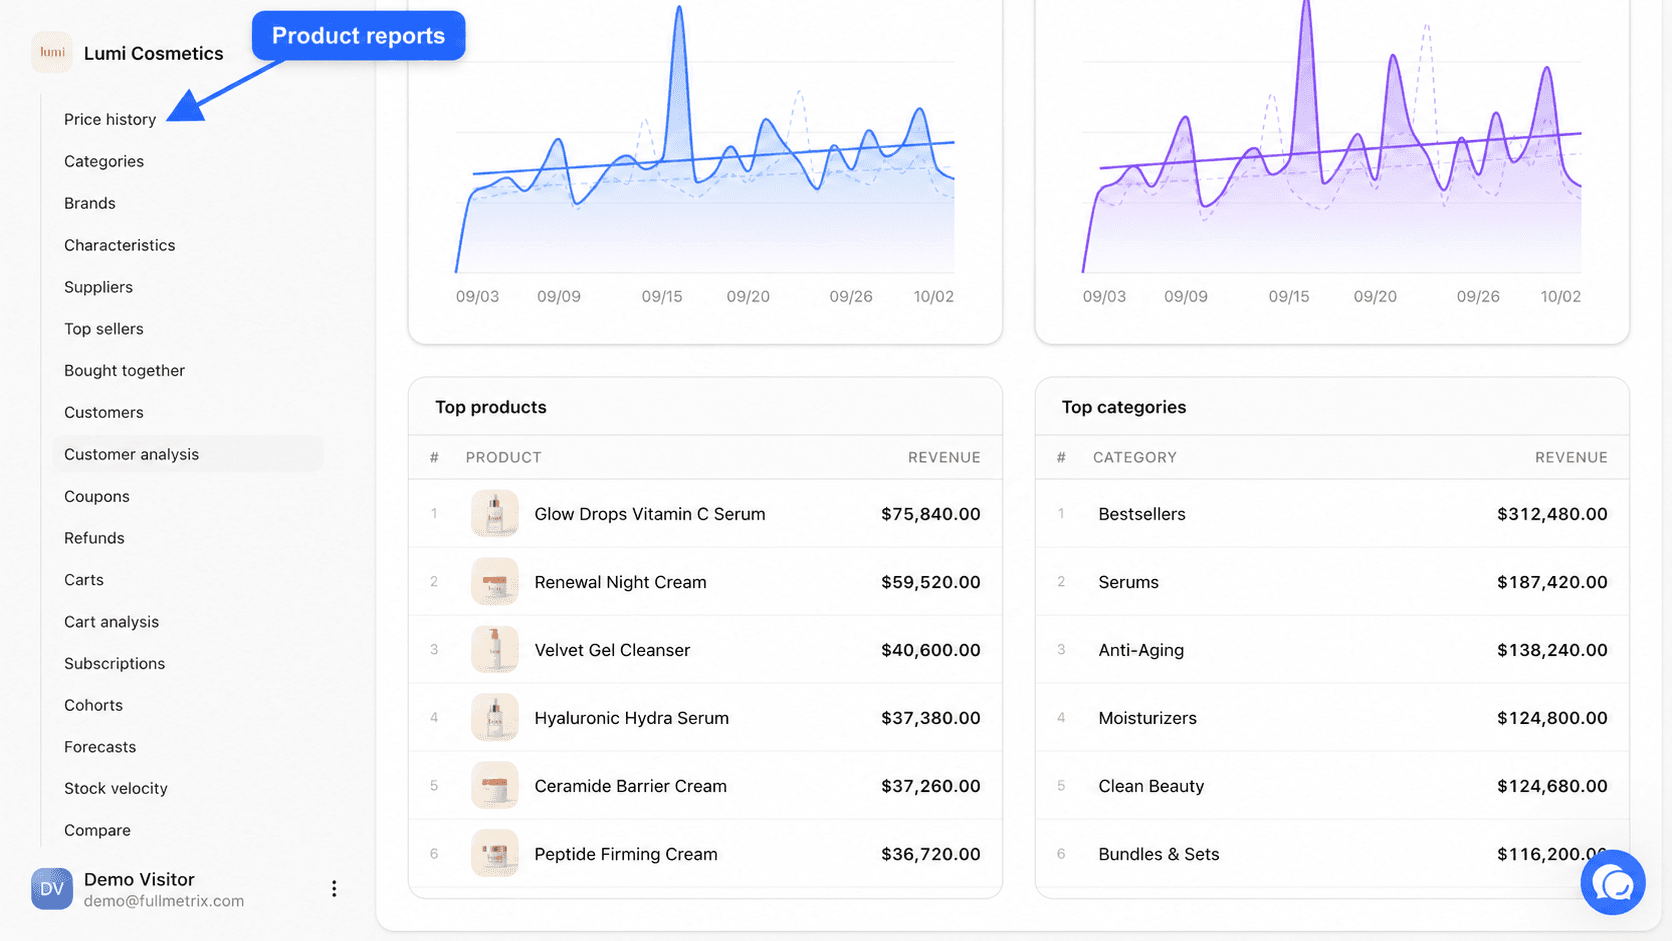
These reports live in the sidebar, in the Data group, under E-commerce. They sit between Order analysis and Customers.
What you need to connect first
You need a connected e-commerce store whose first sync has finished. While the import runs, the reports show Syncing and update on their own. If no store is connected, the E-commerce group does not appear in the menu. To connect a store, follow the quickstart guide.
Why some entries are missing from your menu
Four entries depend on what your catalog contains. We only show them when your synced data contains at least one matching item.
| Menu entry | It appears when |
|---|---|
| Variations | at least one product has variants (size, color, volume...) |
| Brands | at least one product has a brand filled in |
| Characteristics | at least one product has a characteristic or attribute filled in |
| Suppliers | at least one product has a supplier filled in |
If you start filling in brands in your store, for example, the Brands entry appears after the next sync. Every other entry in the section is always visible.
How we count the sales of a product
All reports in this section start from the lines of your orders. A line is one product in one order, with its quantity and amount.
- Quantity sold is the sum of the quantities of these lines over the selected period.
- Revenue is the sum of the amounts of these lines, as your store sends them.
- An order only counts if its status is not excluded in Settings, Reports tab, and if its customer is not on the ignored customers list.
This product revenue does not go through the net sales deductions (taxes, shipping, fees) that apply to the Revenue report. So it is normal that the sum of your products does not land exactly on the Revenue total. The settings that affect product reports are described in Report settings.
Product and variation
A variation is a version of a product, for example the t-shirt in size M. In the Products report, the sales of all variations add up on the main product. In the Variations report, each variation has its own row.
Reports in this section
Products
Your catalog with the stock, quantity sold and revenue of each product, and its detail page.
Variations
Sales and stock variation by variation, to find out which size or color sells best.
Price history
Every price change of each product, day by day, next to the units sold.
Categories
Sales grouped by the categories of your store.
Brands
Sales grouped by brand, across all your stores.
Characteristics
Sales by characteristic value, for example by color or material.
Suppliers
Sales grouped by supplier, to prepare restocking and negotiations.
Top sellers
The 20 products, variations and categories that earned the most over the period.
Bought together
The pairs of products that most often end up in the same order.
Stock velocity
The sales pace of each product and the date its stock will run out.
Which report to start with
For a first look, open Top sellers. It shows your best earning products, variations and categories on a single page. Then open Products to dig into a specific item. If you manage stock, check Stock velocity once a week to anticipate stockouts.
All these reports share the same tools. The date picker is described in Date range and comparison, store selection in Store selector, filters in Filters and segments and columns in Columns.