Price history
Find every price change of your products, day by day, and see how sales reacted.
The Price history report keeps track of the price of every item in your catalog. For one item, it shows its price curve day by day, the units sold over the same period and the dated list of all its price changes. Use it to check that a promotion was applied, measure the effect of a price increase or find out since when a price changed.
Open the report
In the sidebar, open E-commerce in the Data group, then click Price history. The entry is always visible once a store is connected.
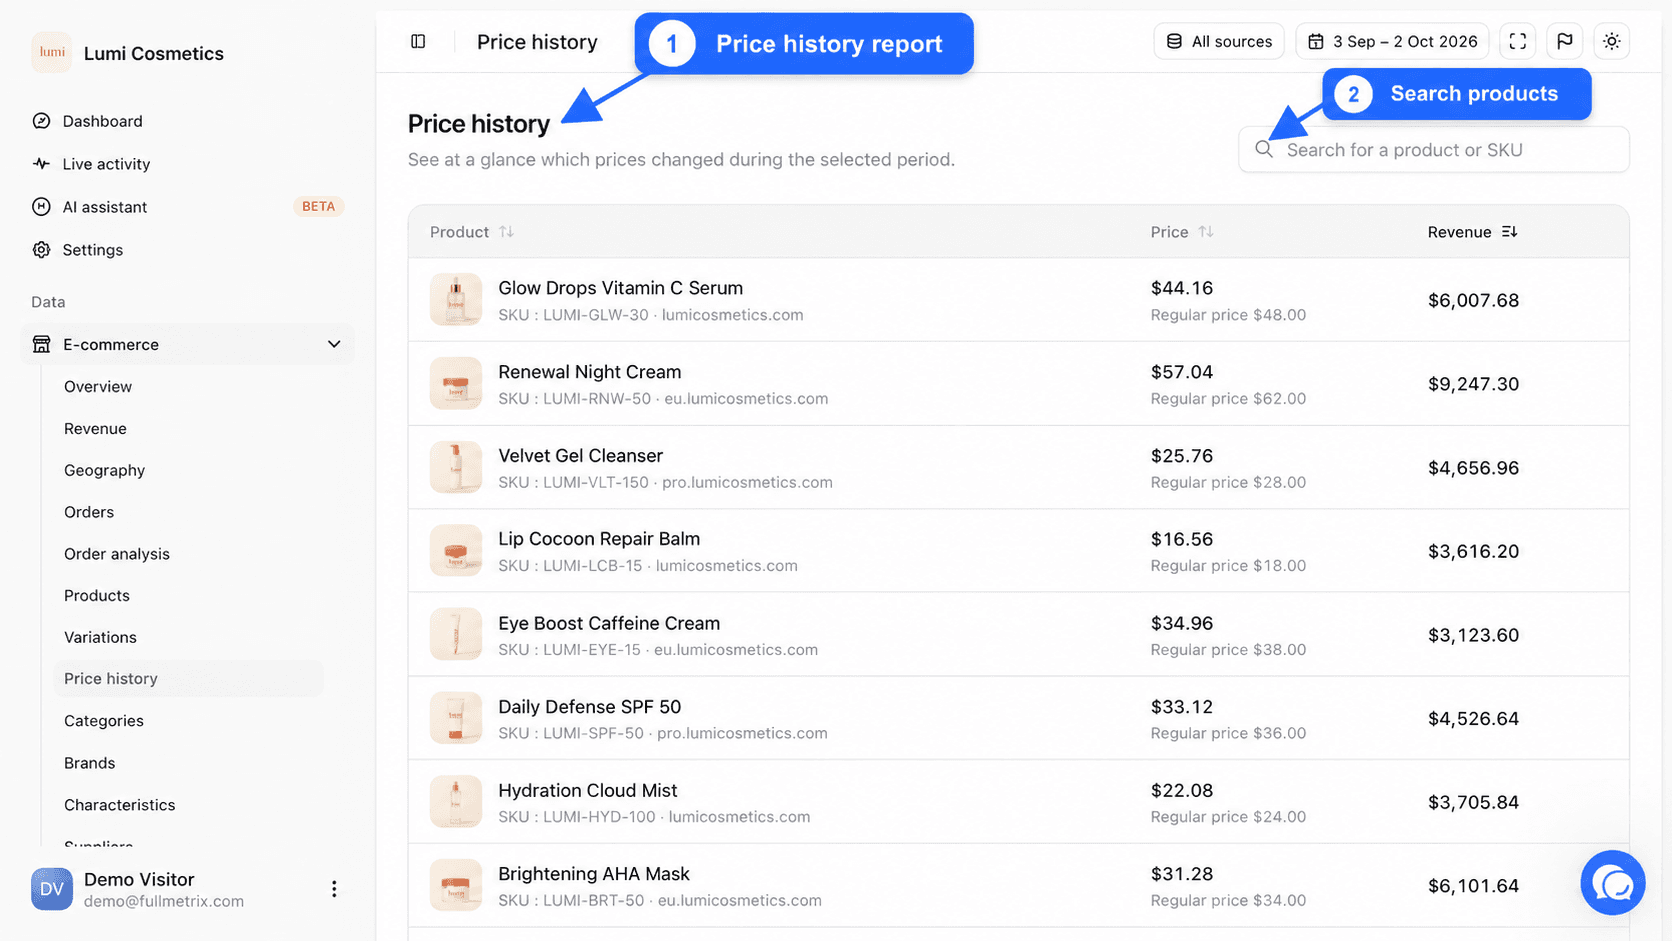
The page opens on the list of items, with the sentence "See at a glance which prices changed during the selected period.". Top right, the All sources button picks the stores and the date picker sets the period you study.
What this report is for
- At what price was this product sold last month?
- Was last week's promotion applied, and on which date did it end?
- Did sales drop after our price increase?
- How many times did we change the price of this item this year?
The list of items
Each row is a sellable item. A simple product has one row. A product with variations has no row of its own, its variations each have one, because every size or color can have its own price.
| Column | What it shows |
|---|---|
| Product | The photo, the item name, then its SKU and the store it comes from. |
| Price | The price of the item on the last day of the selected period. If the item was on sale that day, its regular price appears below, preceded by Regular price. |
| Revenue | The sum of the order line amounts for this item over the period, with the same rules as the Products report. |
The tracked price is the price displayed to customers when your store sends it, taxes included where applicable. Otherwise, it is the selling price recorded in the catalog.
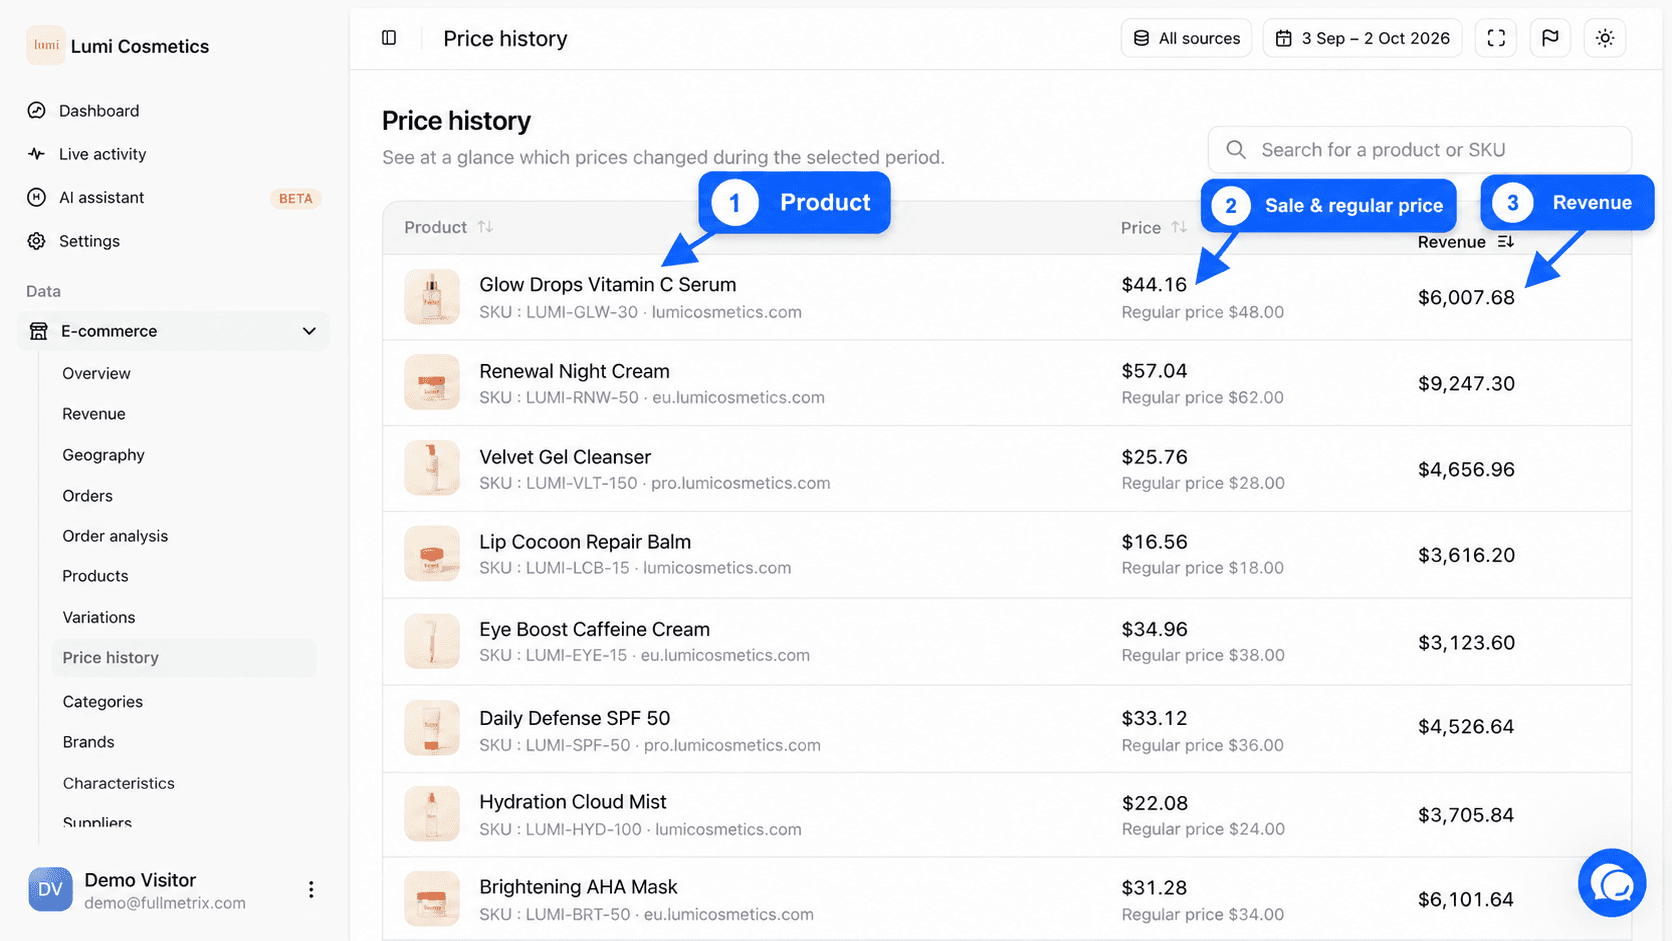
Click the Product, Price or Revenue header to sort. By default, the items that earned the most during the period are at the top.
The Search for a product or SKU field filters the list by name or reference. Below the table, the pagination shows for example "1-20 of 860 references".
This report has no filter bar, no column picker and no export button.
The item detail page
Click a row to open the item page. The Price history breadcrumb takes you back to the list.
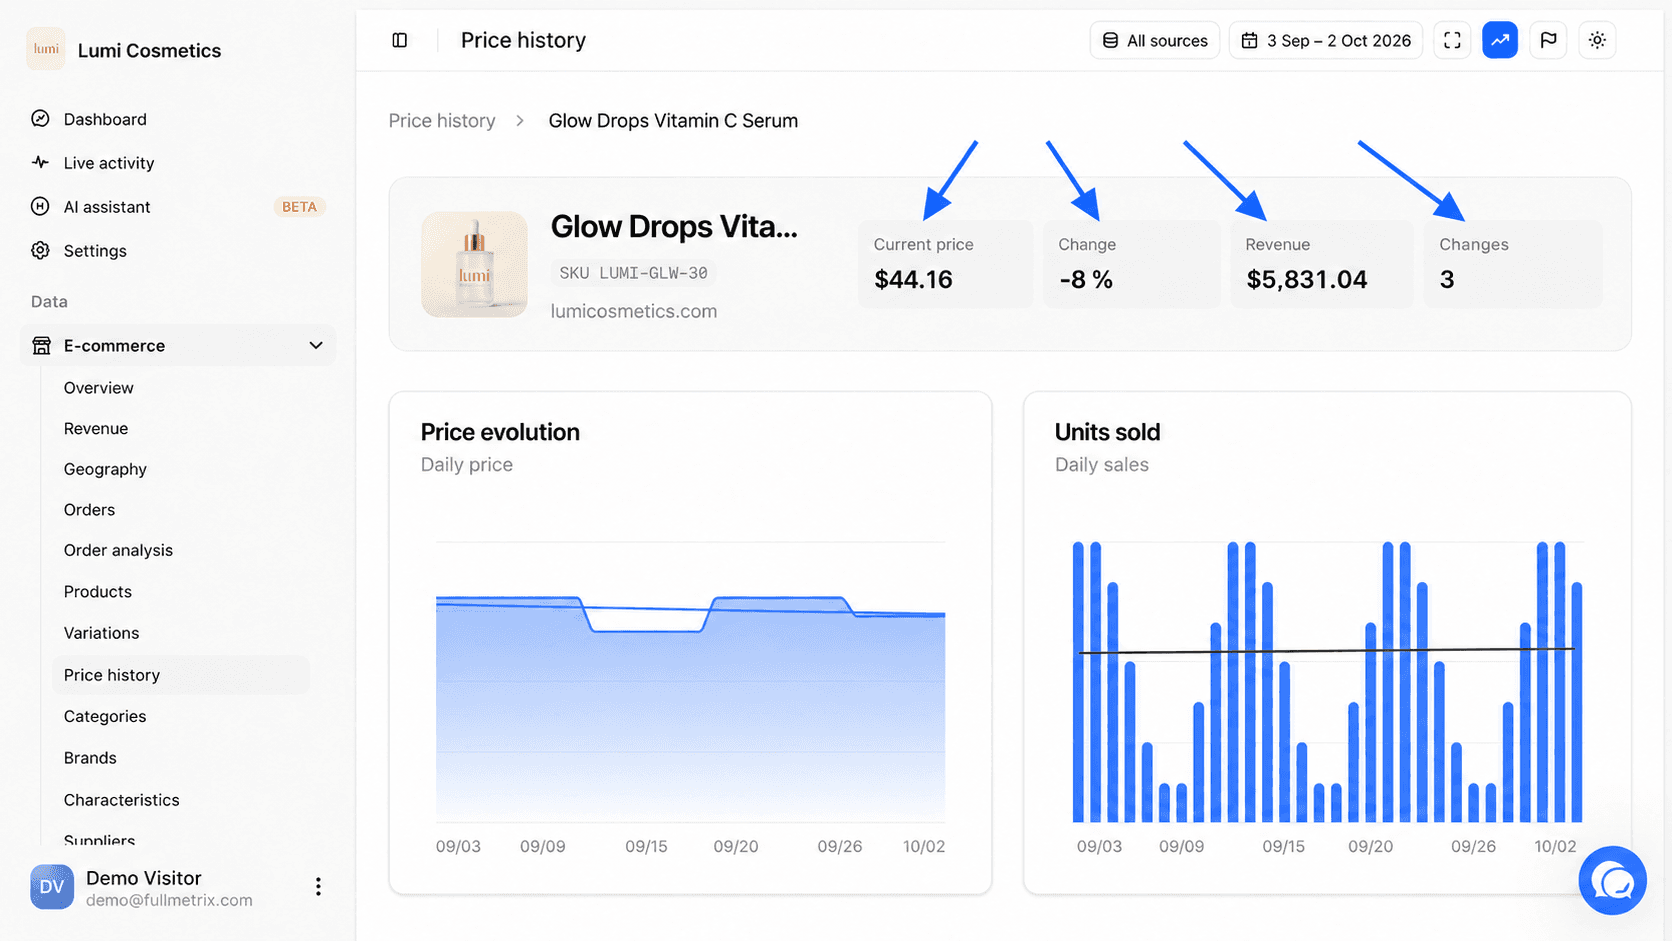
The four tiles
| Tile | Definition |
|---|---|
| Current price | The price on the last day of the selected period. |
| Change | The percentage difference between the price on the first day and the price on the last day of the period. It shows 0 % if the price is the same on those two dates, even if it changed in between. |
| Revenue | The revenue of the item over the period. |
| Changes | The total number of known price changes for this item, from the start of its history until today. This number does not depend on the period. |
The two charts
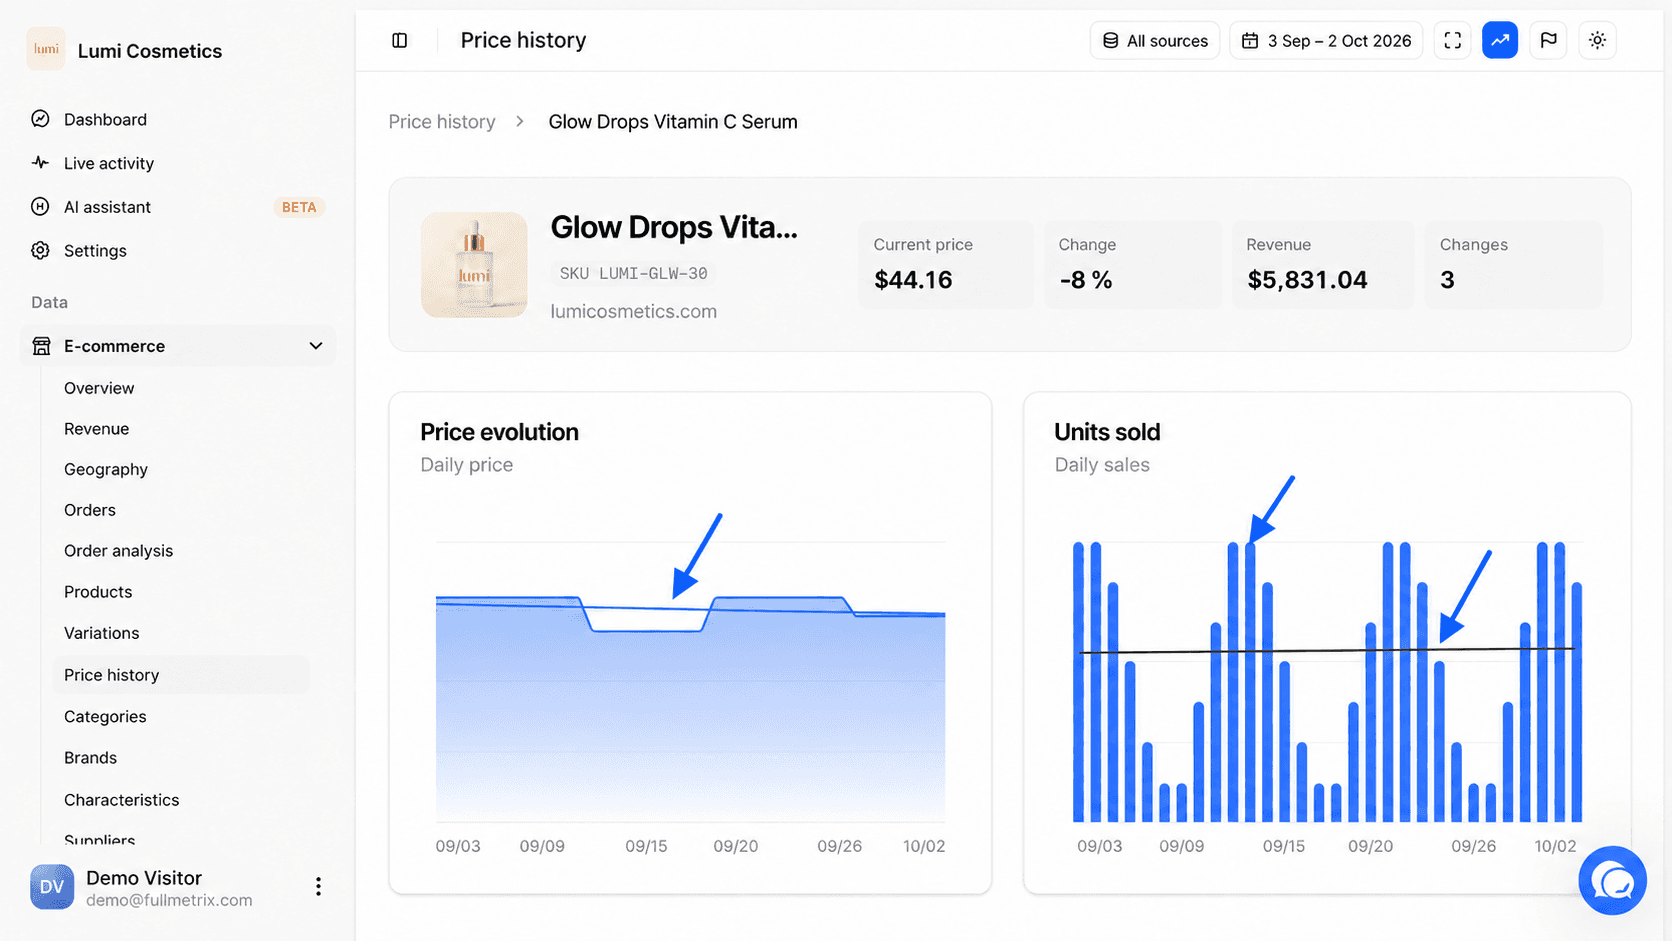
Price evolution plots the displayed price for each day of the period.
Units sold shows the quantities sold each day of the period as bars. When Show trends is turned on in the header, a trend line is added to the bars.
The two charts are synced. Hover a day on one to see the same day on the other. You can see right away whether a price drop pushed sales up.
The changes table
The Price changes block lists every change, from most recent to oldest.
| Column | What it shows |
|---|---|
| Date | The day the new price took effect. |
| Previous price | The price right before the change. |
| New price | The price after the change. |
| Change | The percentage difference. A decrease shows in green with a down arrow, an increase in red with an up arrow. |
The 20 latest changes show first. If there are more, a button such as Show 20 more changes loads the rest. If the price never changed, the block shows Stable price and "No price changes recorded".
Where the history comes from
We record the price of each item at every sync of your catalog. As soon as it changes, we store the new price with its date.
For the period before your store was connected to Fullmetrix, we rebuild the history from the prices actually paid in your orders, keeping the highest price paid each day. That part of the history is an estimate. A day without sales gives no price, and a discount granted on every order of a day can look like a price change.
If the page is empty
| What you see | What it means |
|---|---|
| No data for this period | We know no price for this item during the selected period, often because it was created later. Widen the period. |
| Unable to load price history | Loading failed. Click Try again. |
| No products found in the list | No item matches the search, or no store is selected. |
Frequently asked questions
To see the item sales in detail (countries, customers, orders), open its page in the Products report.