Categories
Compare the sales of each category of your store and open a category page to see its products, countries and customers.
The Categories report groups your sales by the categories of your store, the ones your customers see in the site menu (for example Women, Dresses, Accessories). It shows how many products each category contains, how many units it sold and how much it earned over the period.
Open the report
In the sidebar, open E-commerce in the Data group, then click Categories. The entry is always visible once a store is connected.
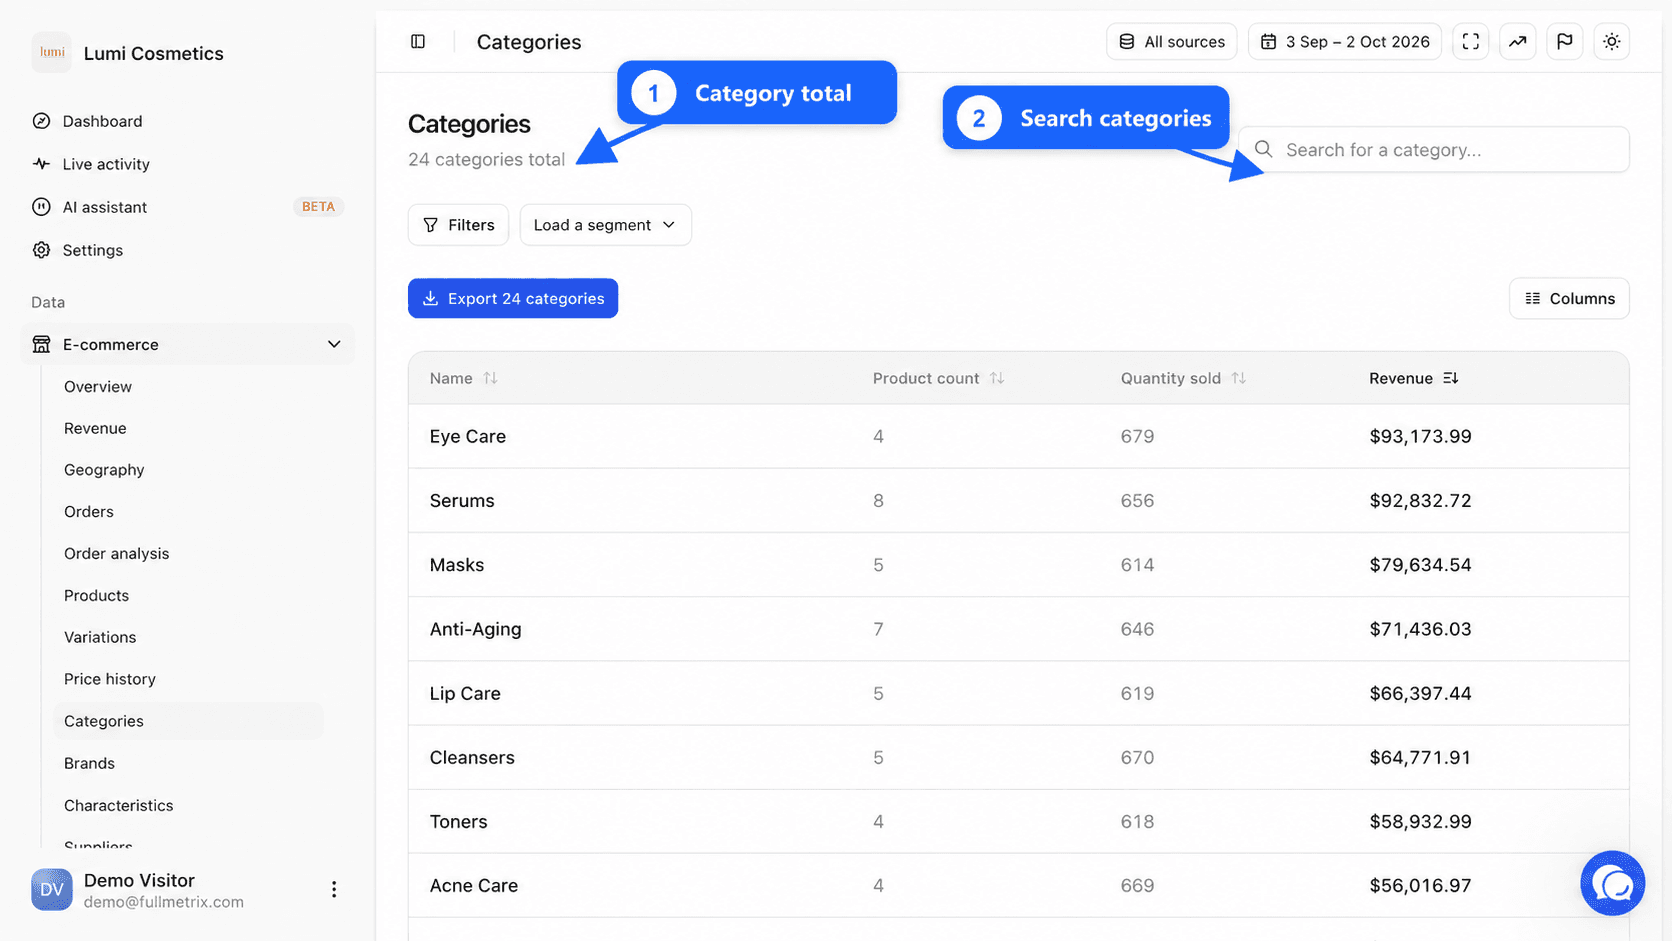
Below the Categories title, a sentence shows the number of categories, for example "48 categories total". All sources and the date picker sit top right.
What this report is for
- Which category earns the most this quarter?
- Did the Sale category do better this year than last year?
- Which categories have many products but very few sales?
- Which products drive the sales of the Shoes category?
Read the table
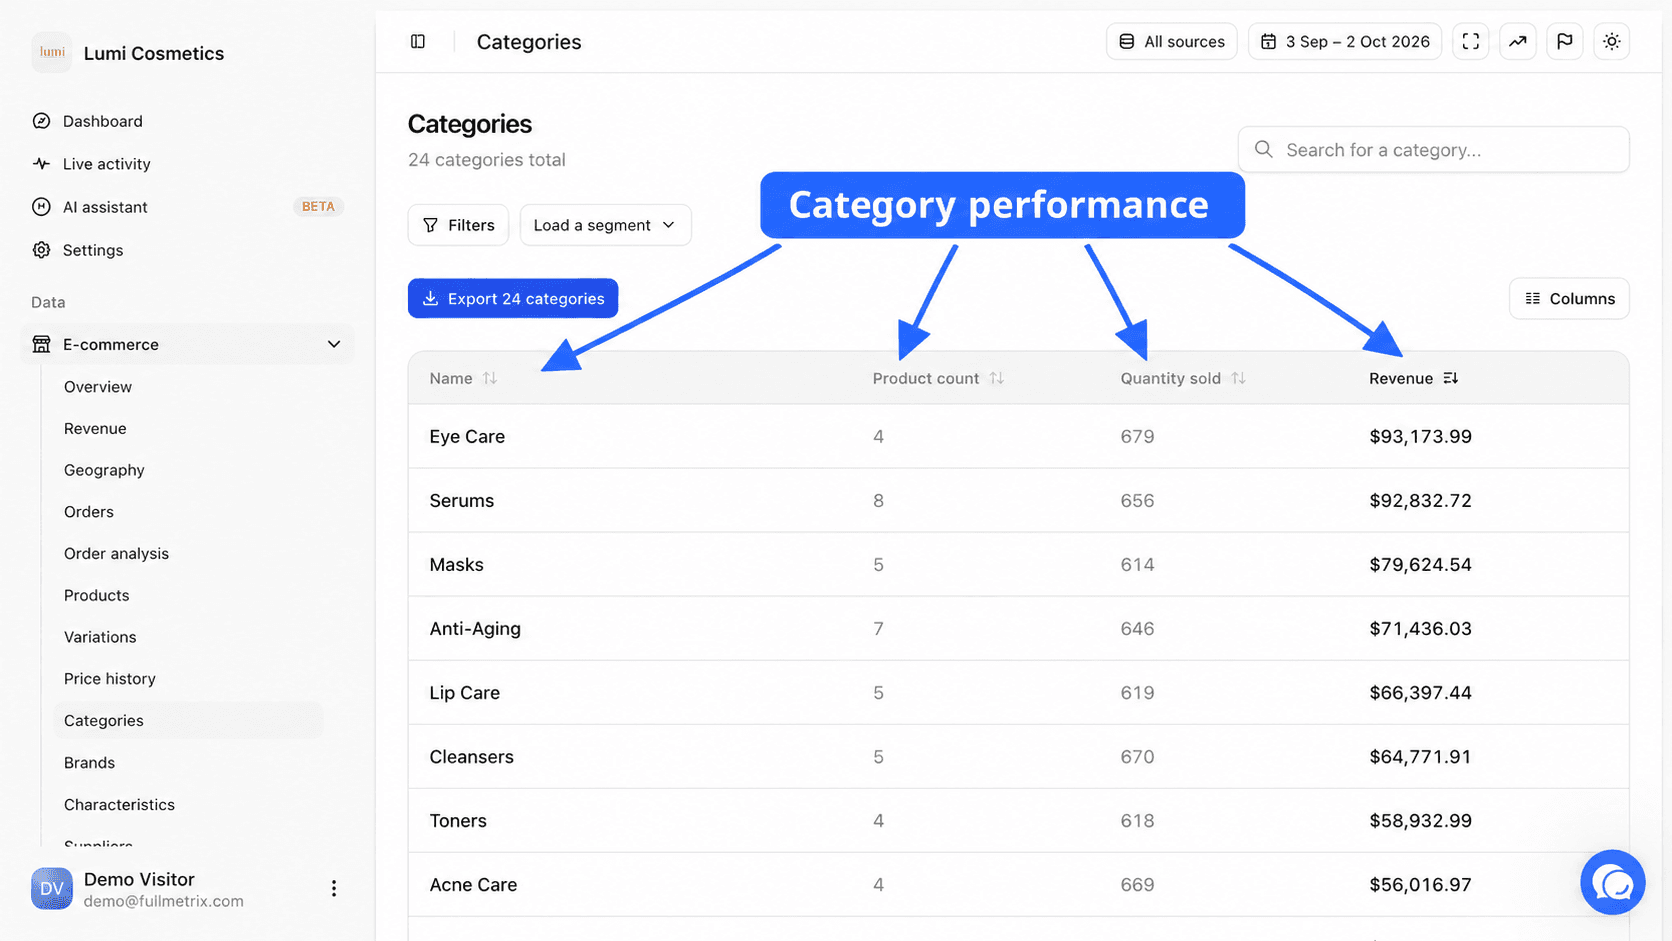
| Column | What it shows |
|---|---|
| Name | The name of the category in your store. |
| Product count | The number of products placed in this category or in one of its direct subcategories. |
| Quantity sold | The number of units sold over the period for the products of the category. |
| Revenue | The sum of the order line amounts for these products over the period. |
Every category is listed, even those that sold nothing during the period.
How a sale is linked to a category
A sale counts in every category the product is placed in, and also in the direct parent category of each of those categories. The sales of a variation count in the categories of its main product.
Take a dress placed in Dresses, itself a subcategory of Women. The sale of this dress counts in Dresses and in Women. If the dress is also placed in New in, it counts in New in too.
Don't add categories together
Since the same sale can count in several categories, the sum of all rows exceeds your real revenue. Compare categories with each other, but take the total from the Revenue report.
Only orders that count in your reports are used. The Only line items over 0 and Exclude refunded orders from product reports settings, in Settings, Reports tab, also apply to categories. See Report settings.
Sort, search and filter
Click a header to sort by Name, Slug, Parent category, Product count, Quantity sold or Revenue. By default, the categories that earn the most are at the top.
The Search for a category... field searches the name, the slug (the part of the category address, for example summer-dresses) and the description.
The filter bar lets you keep for example Parent category equals "Women" to compare the subcategories of one department, or Product count is greater than 0 to hide empty categories. See Filters and segments.
Columns and export
The Columns button offers Default, All fields and Customize. You can add E-commerce source, Slug, Description and Parent category. See Columns.
The Export button, for example "Export 48 categories", downloads the filtered list with the displayed columns. See Exports.
The category detail page
Click a row to open the category page. The breadcrumb shows Categories, the parent category if there is one, then the category.
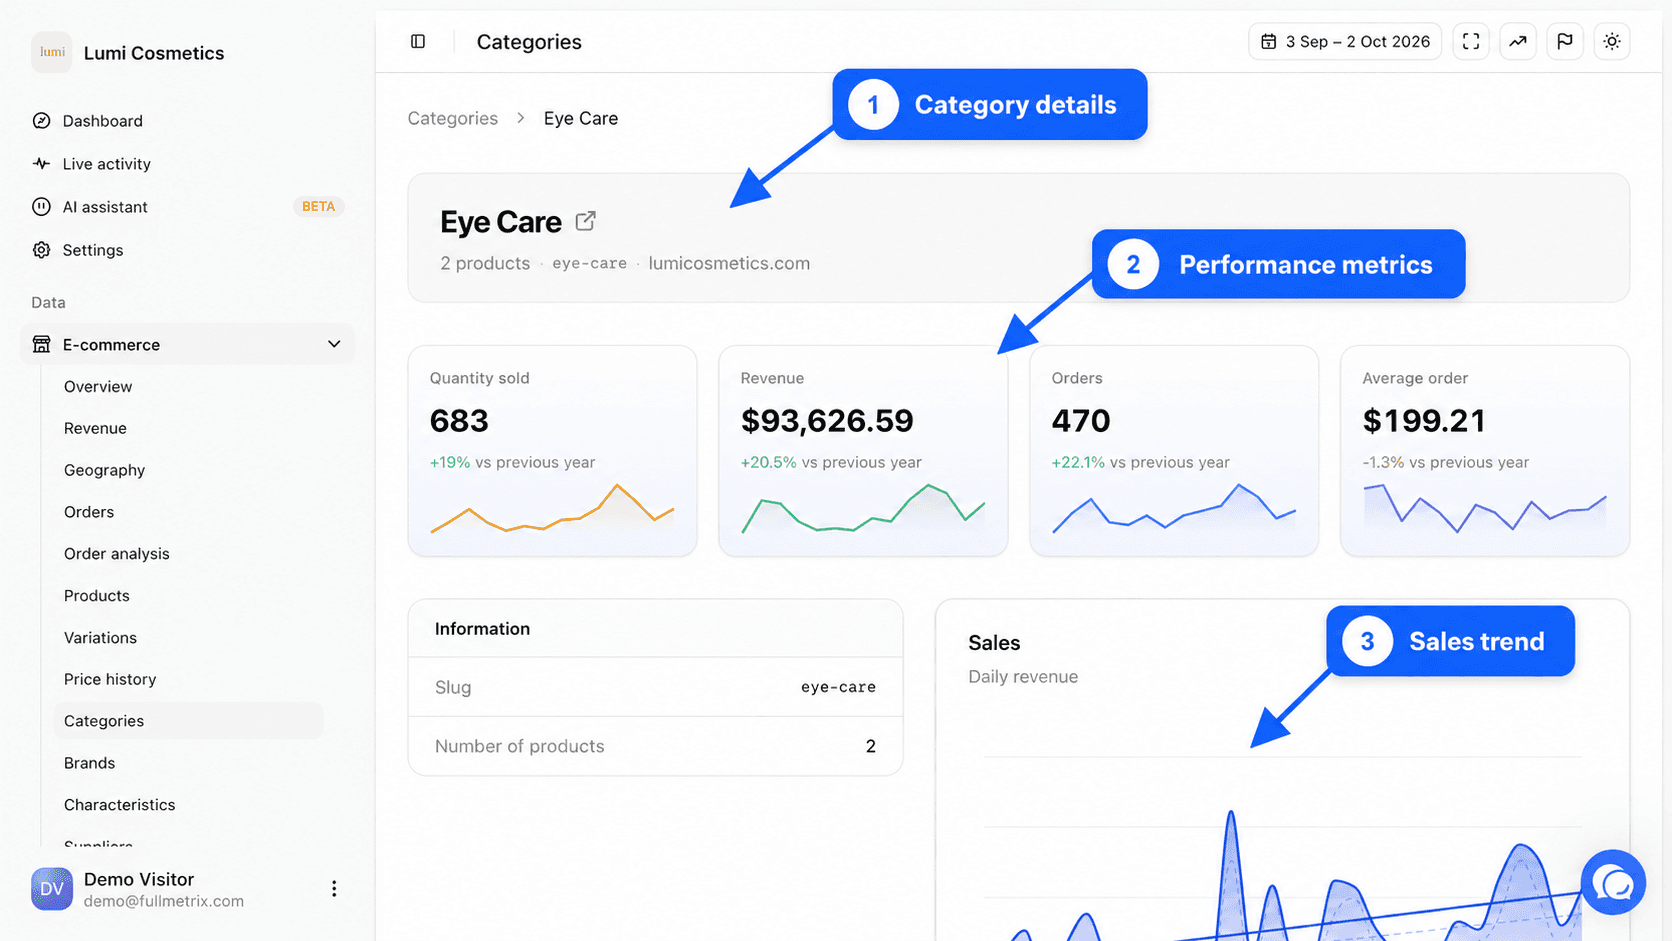
The header shows the category name, the number of products, its slug and the store. The icon next to the name opens the category page on your site.
The metrics
| Metric | Definition |
|---|---|
| Quantity sold | Units sold over the period for the products of the category and its direct subcategories. |
| Revenue | The line amount of these products over the period. |
| Orders | The number of orders that contain at least one of these products. |
| Average order | The revenue of the category divided by that number of orders. |
Each metric shows its change against the comparison period of the date picker.
The blocks on the page
- Information shows the Slug, the Number of products and the Description of the category.
- Sales plots the category revenue day by day, with the comparison period overlaid.
- Sales by hour and Sales by day break that revenue down by order hour and day of the week.
- Variations lists up to 100 variations of the category, with their product ID, units sold and revenue. This block only appears if the category contains products with variations.
- Sales breakdown ranks the 20 products that earn the most in the category, with a donut chart of their share.
- Sales by country and Sales by customer show the 10 countries and 10 customers that weigh the most.
- N orders in this category lists recent orders that contain a product of the category. Click one to open the order.
Each block can be downloaded as CSV with its export button. Click a product to open its page.
Differences between platforms
Categories come from your store as they are. On Shopify, they are collections. On PrestaShop, WooCommerce, Magento and Sylius, they are the catalog categories (taxons on Sylius). A store that places a product in several categories, which is common on PrestaShop and WooCommerce, will see that product count in each of them.
If the page is empty
No categories found appears when nothing matches the search or the filters. The message "Categories will appear here once data is synced" means the import is not finished yet. Category not found on a detail page means the category was deleted from the store.
Frequently asked questions
For a quick ranking of the best selling categories, see also Top sellers.