Stock velocity
Measure how fast each product sells and estimate how many days of stock you have left, so you can restock before you run out.
The Stock velocity report combines two things, what you sell each day and what you still have in stock. From those, it works out how many days each product has left before it runs out, and the date that will happen if the current pace continues. Open it before you place your supplier orders.
Open the report
In the sidebar, open E-commerce in the Data group, then click Stock velocity. The entry is always visible once a store is connected.
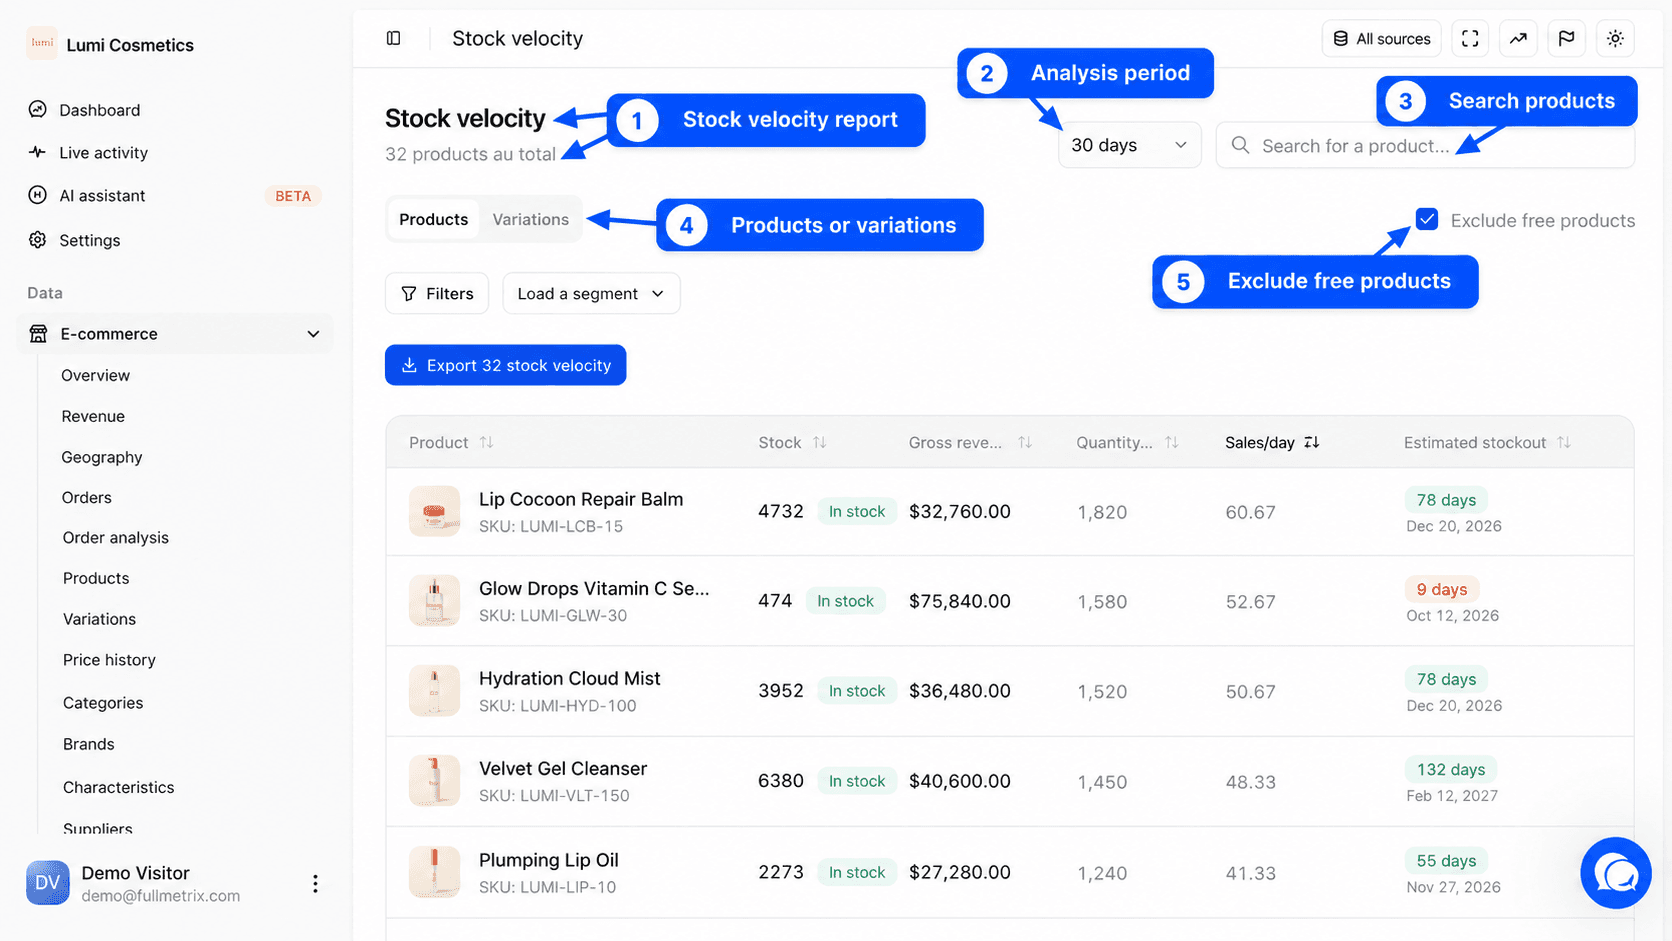
Under the Stock velocity title, a line shows the number of rows, for example "32 products total". This report does not use the date picker in the header. It has its own period menu, described below. At the top right, All sources lets you pick the stores.
What this report is for
- Which products will run out in less than two weeks?
- How many units of this product do we sell per day on average?
- How much should we order to last until the next delivery?
- Which products have too much stock for how fast they sell?
Set up the analysis
| Setting | Effect |
|---|---|
| Period menu | Sets the window used to measure the sales pace, among 7 days, 14 days, 30 days, 60 days and 90 days. The window ends today. The default is 30 days. |
| Search for a product... | Filters the list by name or SKU. On the Variations tab, the field becomes Search for a variation.... |
| Products and Variations tabs | Products shows one row per main product, with the sales and stock of all its variations added together. Variations shows one row per variation. This tab only appears if your catalog has variations. |
| Exclude free products | Checked by default. Ignores order lines at 0 (samples, gifts), which leave your stock but do not reflect demand. |
A short window reacts quickly to a recent trend, such as a product taking off or a running promotion. A long window smooths out ups and downs and suits products that sell steadily.
Only products that sold are listed
The report only shows products sold at least once in the chosen window. The reminder "Only products with at least 1 sale in the last 30 days are shown." appears under the table. To find a product that no longer sells, use the Products report sorted by Name.
Read the table
| Column | What it shows |
|---|---|
| Product or Variation | The picture, the name and the SKU. On the Variations tab, the name of the main product also appears. |
| Stock | Current stock with an In stock, Out of stock or On backorder badge. For a product with variations, it is the sum of the stock of its variations. |
| Gross revenue | The sum of the order line amounts for the product over the chosen window. |
| Quantity sold | The units sold over the window. |
| Sales/day | The quantity sold divided by the number of days in the window. A product sold 60 times over 30 days sells 2 per day. |
| Estimated stockout | Current stock divided by sales per day, rounded to the nearest day, with the estimated stockout date below it. |
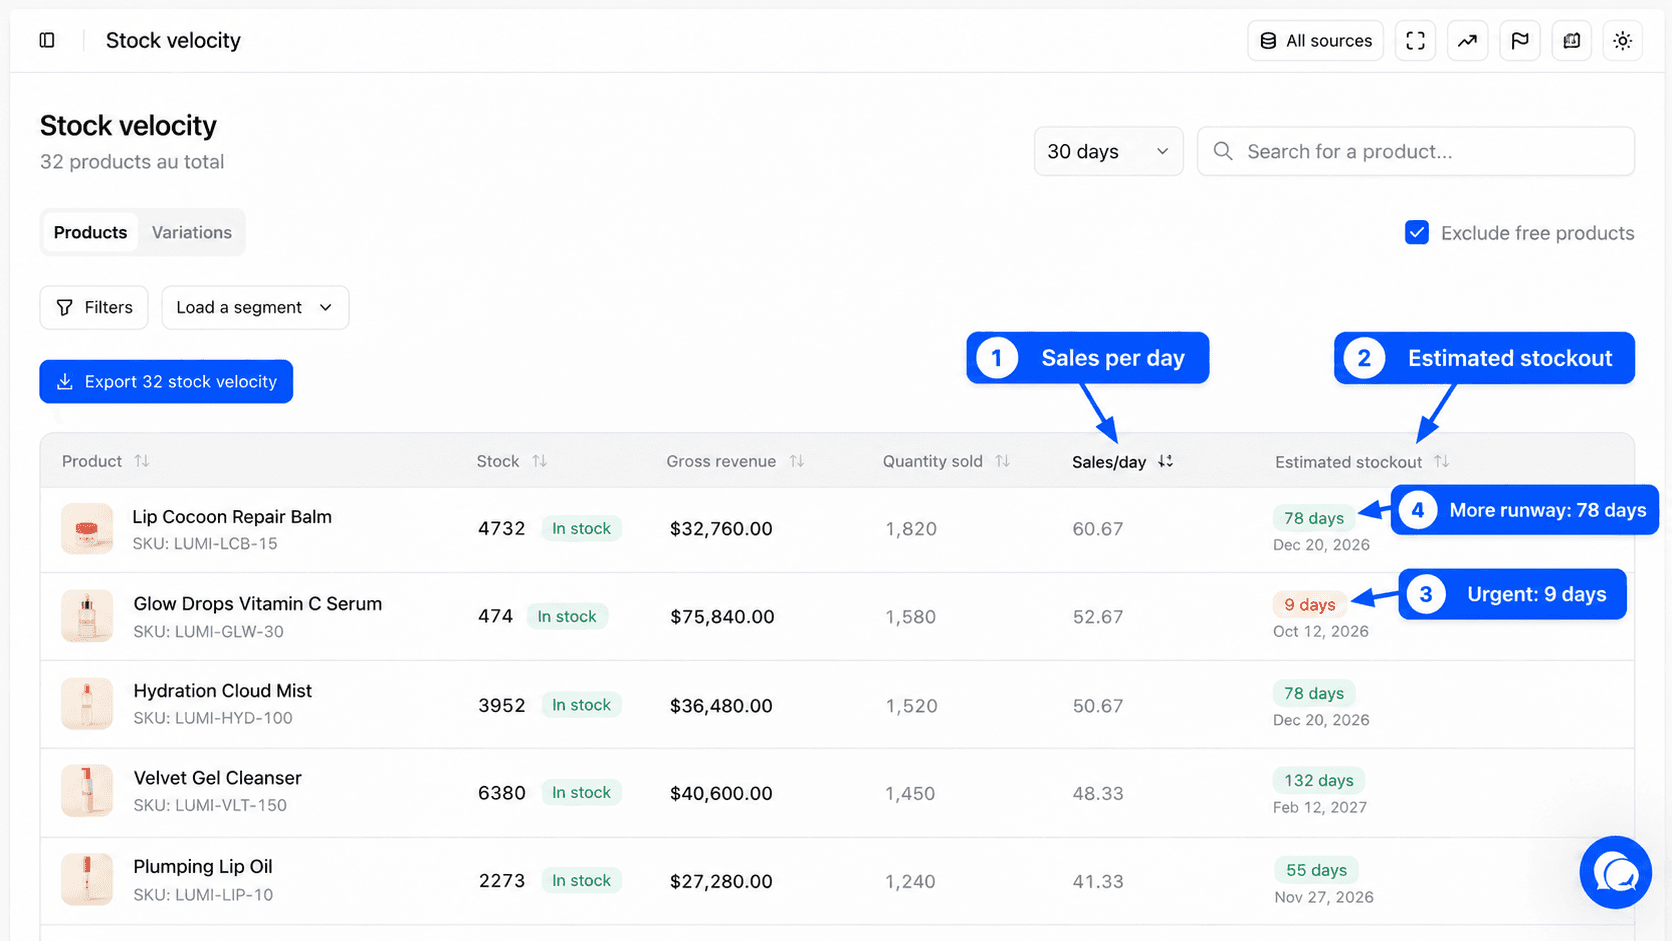
The Estimated stockout badge changes color with urgency.
| Color | Meaning |
|---|---|
| Red | less than 14 days of stock |
| Orange | between 14 and 30 days |
| Green | more than 30 days |
A dash instead of the badge means we cannot do the calculation, usually because your store does not track stock for that product.
For example, you have 40 units of a backpack left. Over the last 30 days you sold 90, which is 3 per day. The estimated stockout is 13 days, in red, with the matching date. If your supplier delivers in three weeks, you need to order now.
Under the table, the Total row adds up the gross revenue and quantity sold of every row in the list, not only the page on screen.
The orders taken into account follow your settings in Settings, Reports tab, and line amounts follow the rules described in Products.
Sort, filter and export
Every header can be sorted. By default, the list is sorted by Sales/day, fastest first. Sort by Estimated stockout to bring the most urgent products to the top.
The filter bar accepts the same fields as the Products report, for example Brand, Product category or Stock status. See Filters and segments.
The Export button downloads the filtered list, all pages included. To receive it every Monday, schedule a recurring export in Exports.
Click a row to open the product or variation page.
Limits of the estimate
The estimate assumes you will keep selling at the same pace. It does not know about restocks already ordered, seasons or upcoming promotions. A product that was out of stock for part of the window sold less than it could have, so its pace is underestimated. The stock used is the one from the last sync.
If the page is empty
"No sales recorded in the last 30 days" means no product sold in the chosen window. Pick a longer window or uncheck Exclude free products. With a search, the message reads "No results for" followed by your search term.