Compare
Put up to 8 order segments side by side over the same period, compare their sales, orders and average order value, and save your comparisons.
The Compare report places several groups of orders side by side over the same period. Each group is a segment, meaning a set of orders defined by filters, for example "orders with a discount code" or "orders shipped to Belgium". You see their curves on one chart and their totals in cards.
Use it to answer questions such as "do my discounted orders have a lower average order value than the others?" or "which product category brings in the most this month?". This report compares groups of orders with each other. To compare one period with another, use the comparison in the date picker of the other reports. See Date range and comparison.
Before you start
You need a connected store whose historical import is finished. You can use your saved order segments or create some right from this report. See Segments.
Open the report
Expand the E-commerce section
In the left sidebar, in the Data group, click E-commerce.
Choose Compare
Click Compare, the last entry in the list. Until you add something, the page shows Compare your order segments.
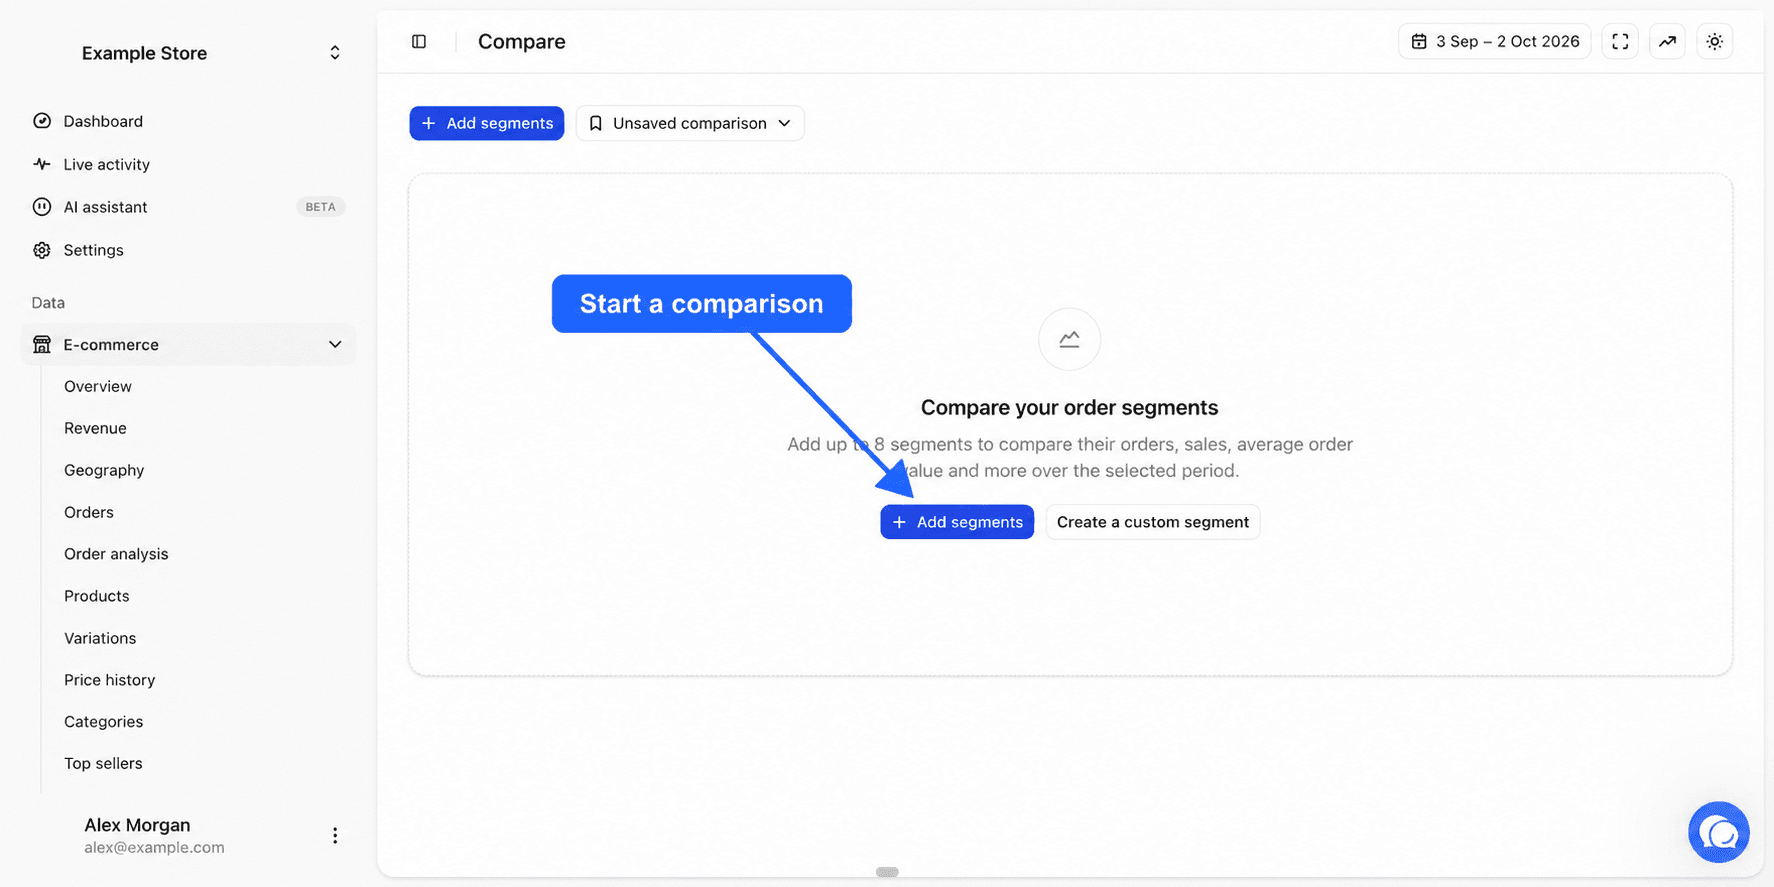
At the top right, the All sources selector picks the stores and the date picker picks the dates. By default you see the last 30 days up to yesterday. Every segment is measured over the same period. See Choosing stores.
Add segments
Open the segment list
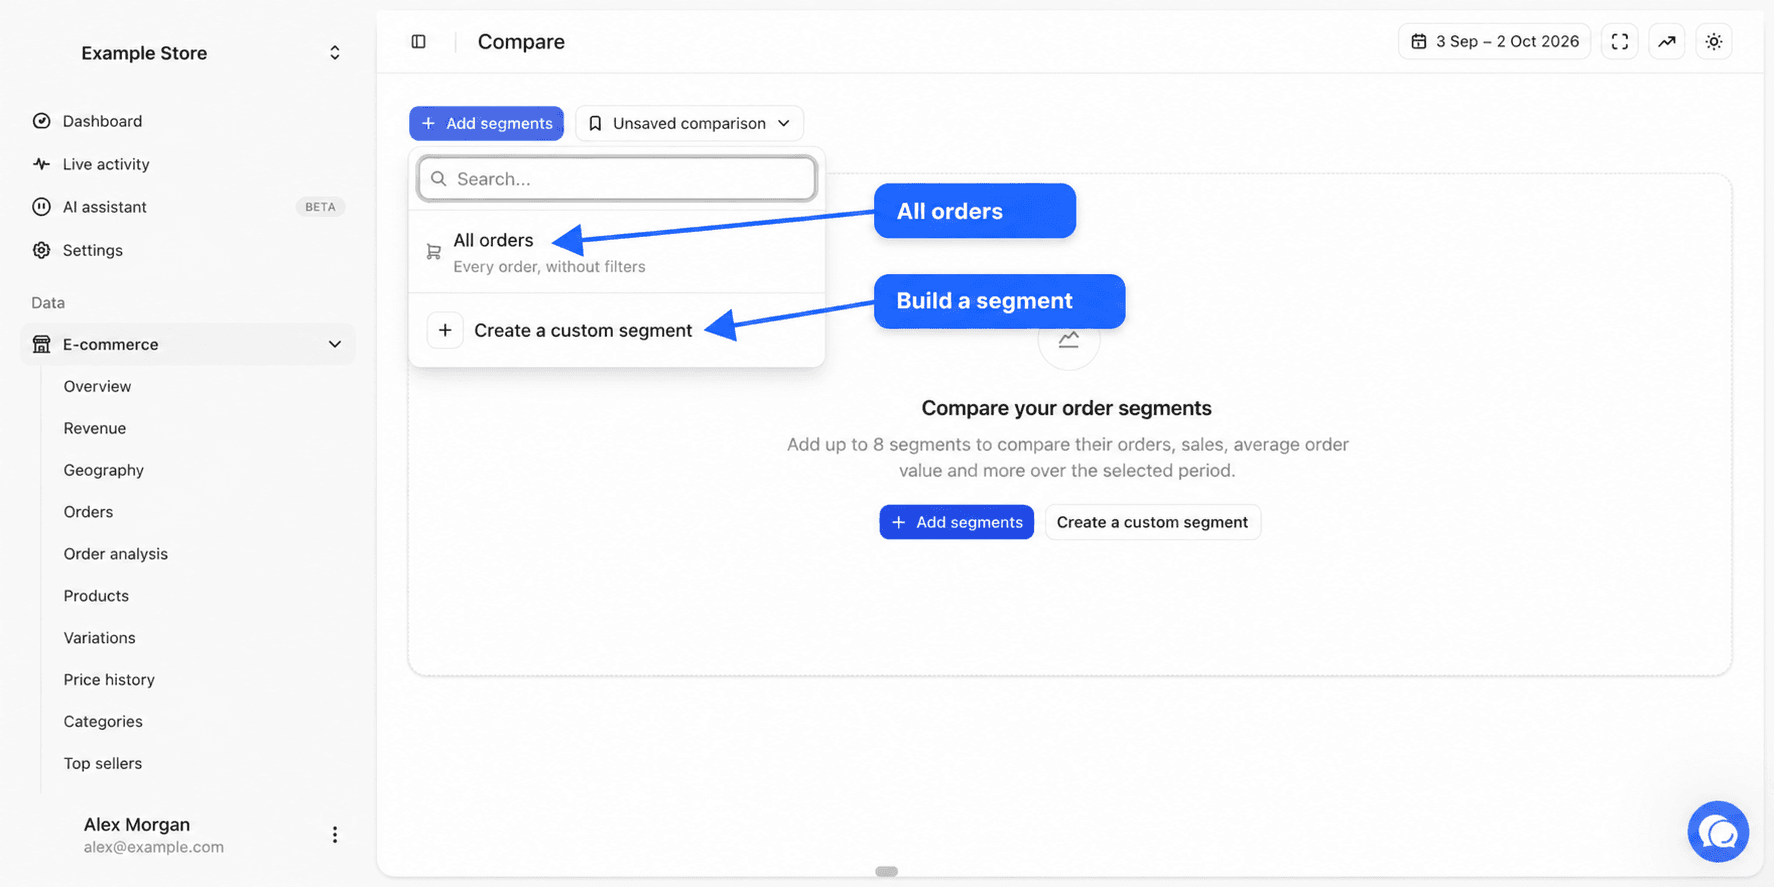
Click Add segments. A list opens, with a search field.
Pick a segment
Click a segment to add it. The list offers All orders, without any filter, then ready-made segments such as Successful orders, Failed orders, Large carts or With discount, then your own order segments. A segment that is already in shows Added.
Or create a custom segment
Click Create a custom segment. Give it a Display name, click Add a filter to define the orders included, then click Add to comparison. This segment only exists in this comparison. It doesn't appear in your segment list.
You can compare up to 8 segments. Beyond that, the Add segments button disappears. Add All orders as a reference to see what share of the total each segment represents.
What each segment measures
Each segment only contains counted orders, placed during the chosen period, with a status that isn't excluded, an amount greater than zero and a customer who isn't ignored. The segment's filters add to that rule. See the E-commerce page and Report settings.
| Indicator | Definition |
|---|---|
| Orders | The number of orders in the segment |
| Revenue | The amount of the segment's orders, after your tax, shipping and fee deductions, minus refunds granted during the period on those orders |
| Refunds | The amount refunded during the period on the segment's orders |
| Items | The quantity of items in the segment's orders |
| Average order value | Revenue divided by the number of orders |
| Items per order | Items divided by the number of orders |
Refunds are only removed from revenue if the Deduct refunds option is on in Settings, Reports tab. It is on by default.
One purchase can belong to several segments. A discounted 300 order counts both in Large carts and in With discount. Segments therefore don't necessarily add up.
The chart
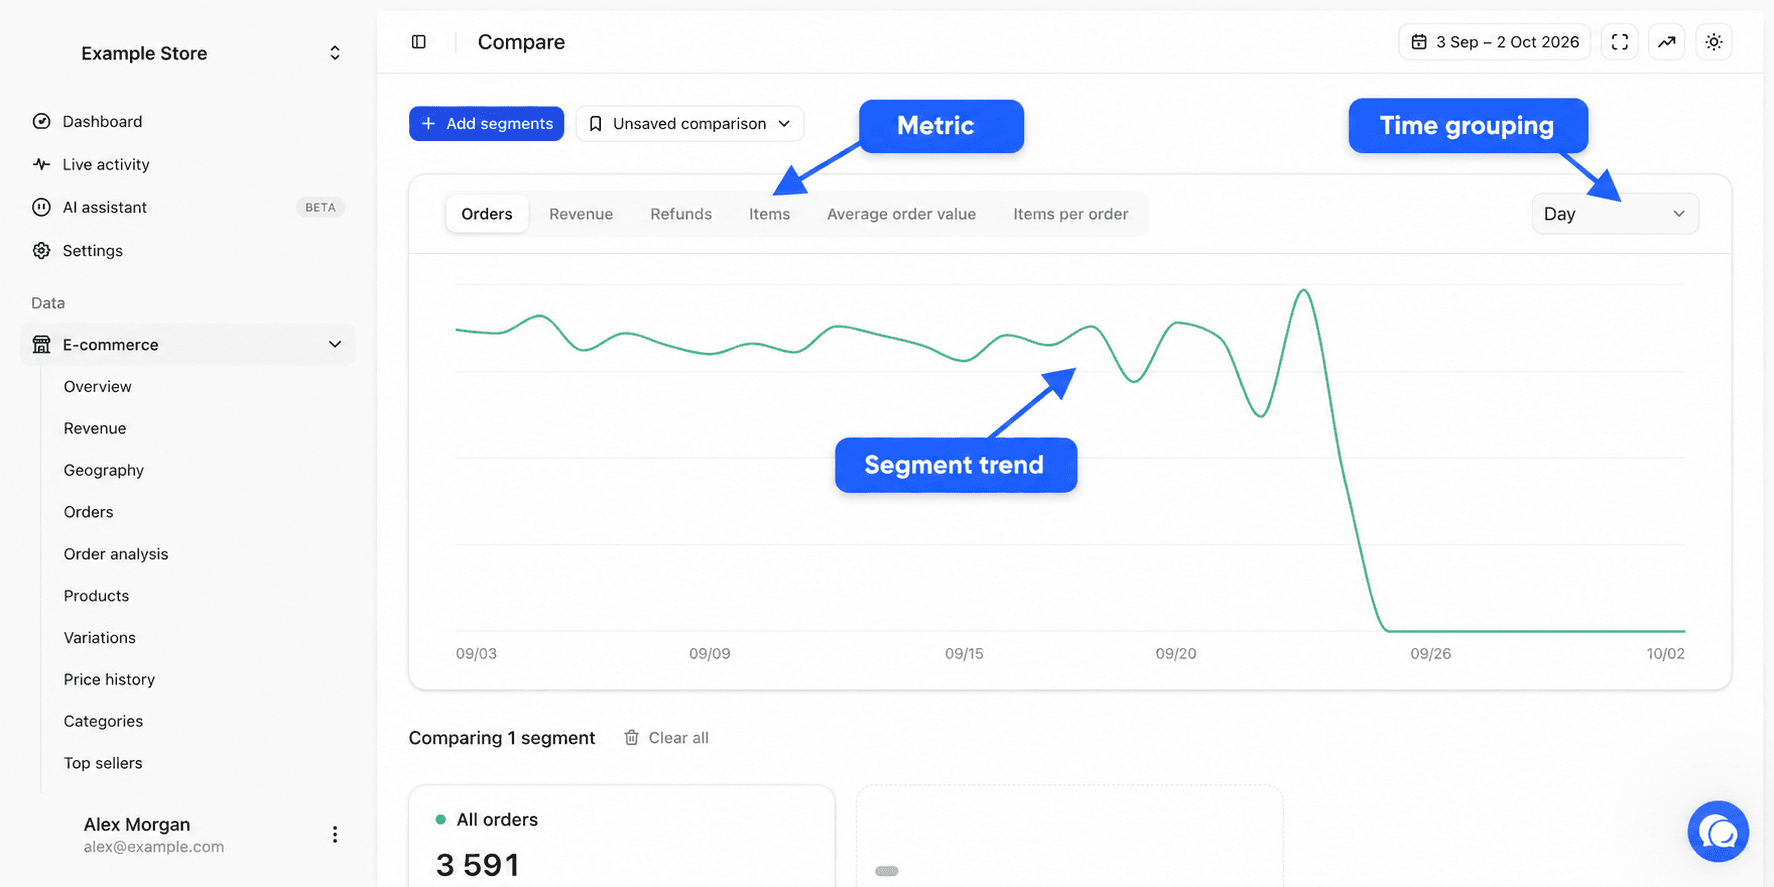
The chart draws one curve per segment, in the segment's color. The buttons above the chart pick the indicator shown, among Orders, Revenue, Refunds, Items, Average order value and Items per order. The menu on the right picks the grouping, Day, Week or Month.
Hover the chart to read each segment's value on a date.
Segment cards
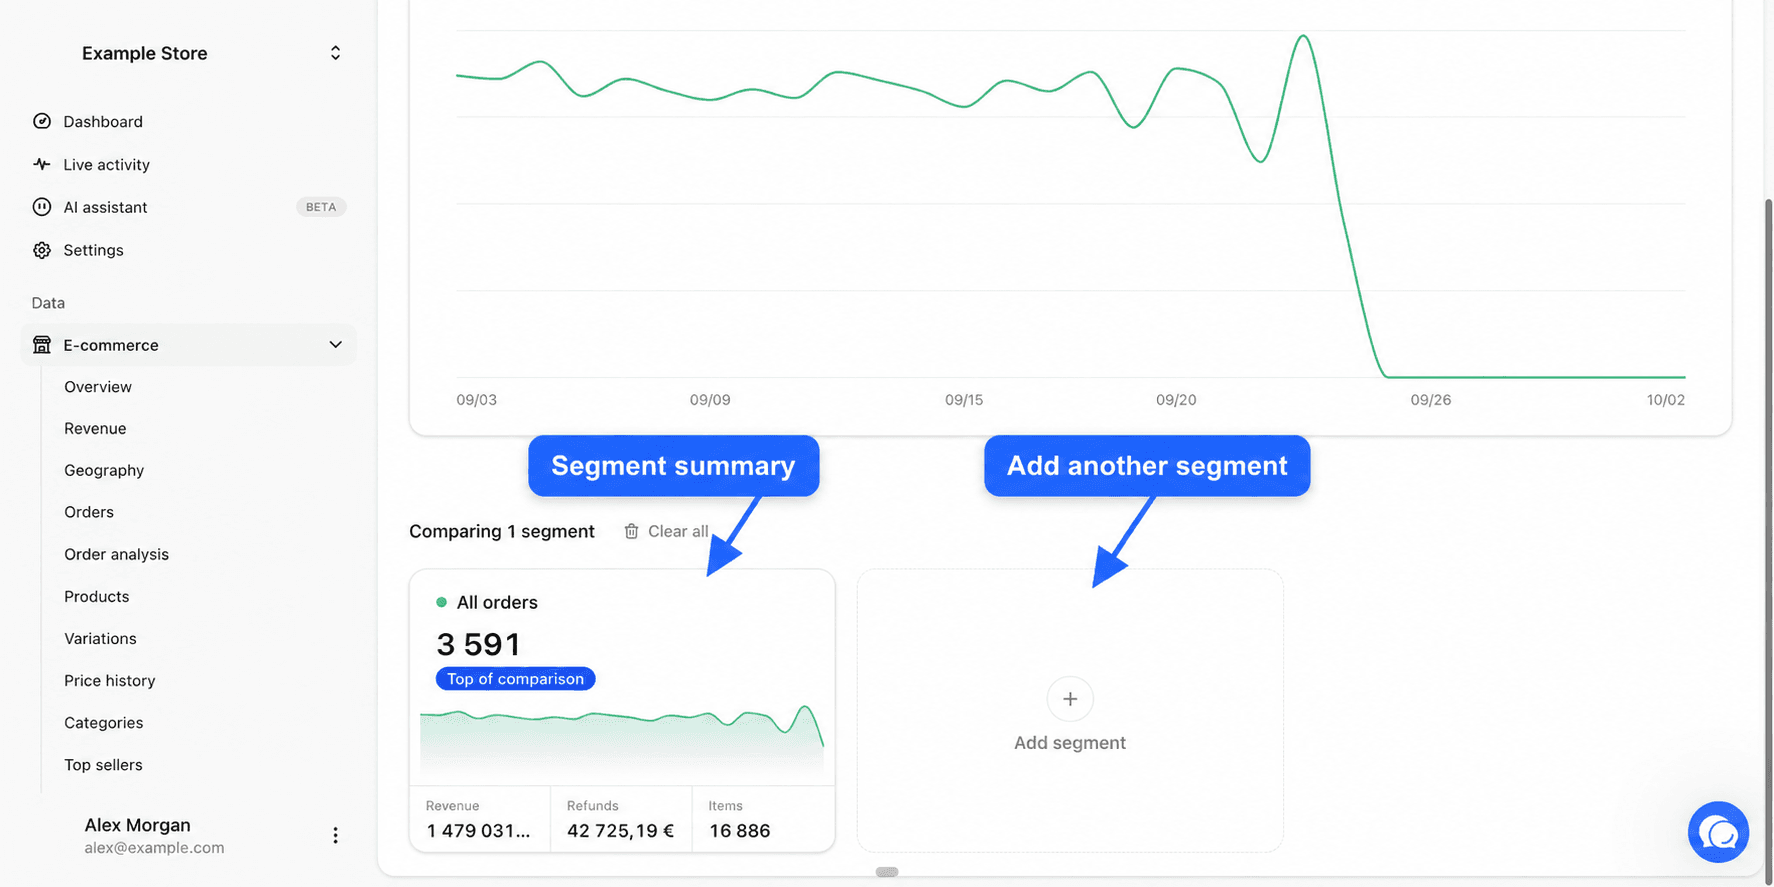
Below the chart, the Comparing X segments line reminds you how many segments there are. The Clear all button empties the comparison.
Each segment has its card. It shows its name and color, its value for the indicator chosen above the chart, a small curve and three other indicators at the bottom.
The highest segment for the chosen indicator carries the Top of comparison label. The others show their gap with it, for example "-35% vs leader".
Hover a card to show its buttons. The Remove from comparison cross removes the segment. The Edit filters pencil only appears on segments created with Create a custom segment. To edit a saved segment, go to the Segments page. The last card, Add segment, reopens the segment list.
Save a comparison
The menu next to Add segments shows Unsaved comparison until you save something.
Save
Open the menu and click Save comparison. Enter a Name, for example "Top categories", then confirm. We keep the segments, the chosen indicator and the grouping.
Reopen
Later, open the same menu. Your comparisons appear under Saved comparisons. Click one to load it.
Update
Once a comparison is loaded, the menu offers Save changes, Save as new, Rename and Delete.
The period isn't saved with the comparison. A reopened comparison uses the period chosen in the date picker at that moment.
Example questions
- Do discounted orders have a lower average order value? Add With discount and All orders, then choose Average order value.
- Which country is growing most this quarter? Create a custom segment per country with a Billing country filter, then switch the grouping to Week.
- Does one category generate more refunds than the others? Create one segment per category and choose Refunds.
- Are my failed orders increasing? Add Failed orders, then choose Orders and Day.
Frequently asked questions
Going further
- Segments to create and manage your segments.
- Filters and segments for filter conditions.
- Revenue to compare one period with another.