Geography
See which countries and regions you sell to, compare your markets and spot the ones that grow or decline.
The Geography report shows where your customers are. It places your sales on a world map, ranks countries, then details each country in a table. For most countries, you can also drill down to regions.
Open it when you wonder where to sell more, when you prepare an ad campaign targeted by country, or when you want to check the effect of opening to a new country.
Before you start
You need a connected store whose historical import is finished. See the E-commerce page.
Open the report
Expand the E-commerce section
In the left sidebar, in the Data group, click E-commerce.
Choose Geography
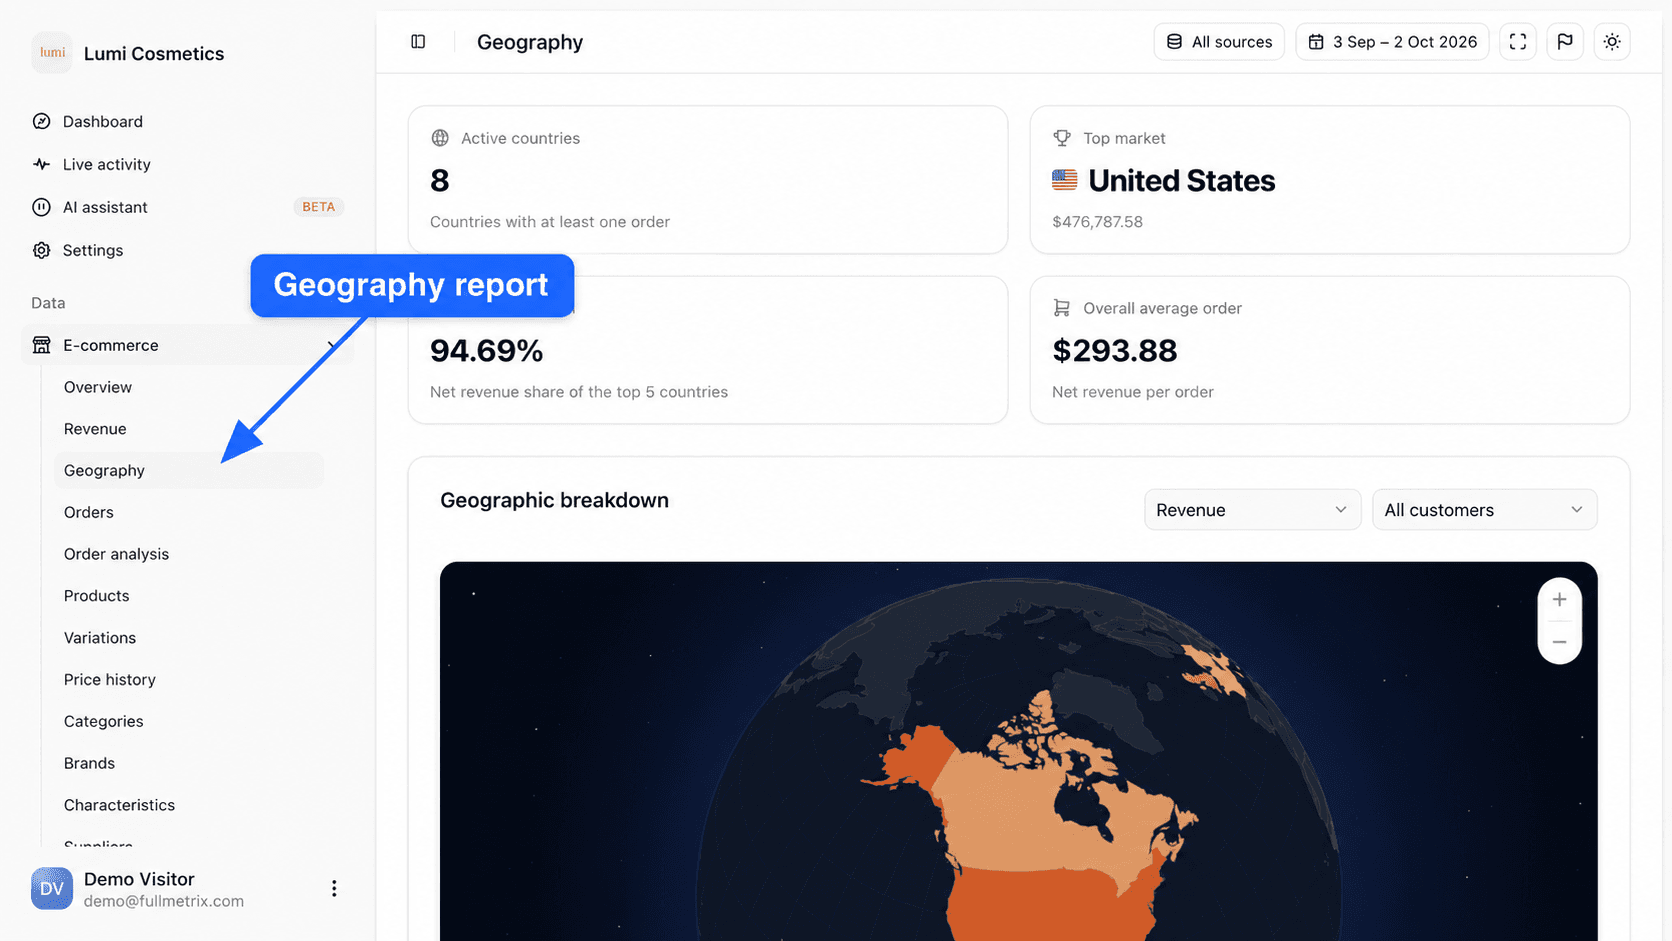
Click Geography, just below Revenue. The Geography title appears at the top of the screen.
Where an order's country comes from
We attach each order to the country of its billing address. An order billed in Belgium and shipped to France therefore counts for Belgium.
Orders with no billing country, or with a country we don't recognize, don't appear in this report. That is why the Geography total can be slightly lower than the Revenue total for the same period.
Otherwise, figures follow the same rules as every report. We only keep counted orders, meaning orders placed during the period, with a status that isn't excluded, an amount greater than zero and a customer who isn't ignored. Revenue removes refunds granted during the period and follows your deductions. The full rule is on the E-commerce page and is set in Report settings.
Set the period and stores
At the top right, the All sources selector picks the stores included and the date picker picks the dates. By default you see the last 30 days up to yesterday. The comparison period chosen in the picker is used to compute the Trend column of the table. See Choosing stores and Date range and comparison.
This report has no Filters button. To isolate one country's orders with other criteria, use the country filter of the Orders report.
The four indicators
| Indicator | Definition |
|---|---|
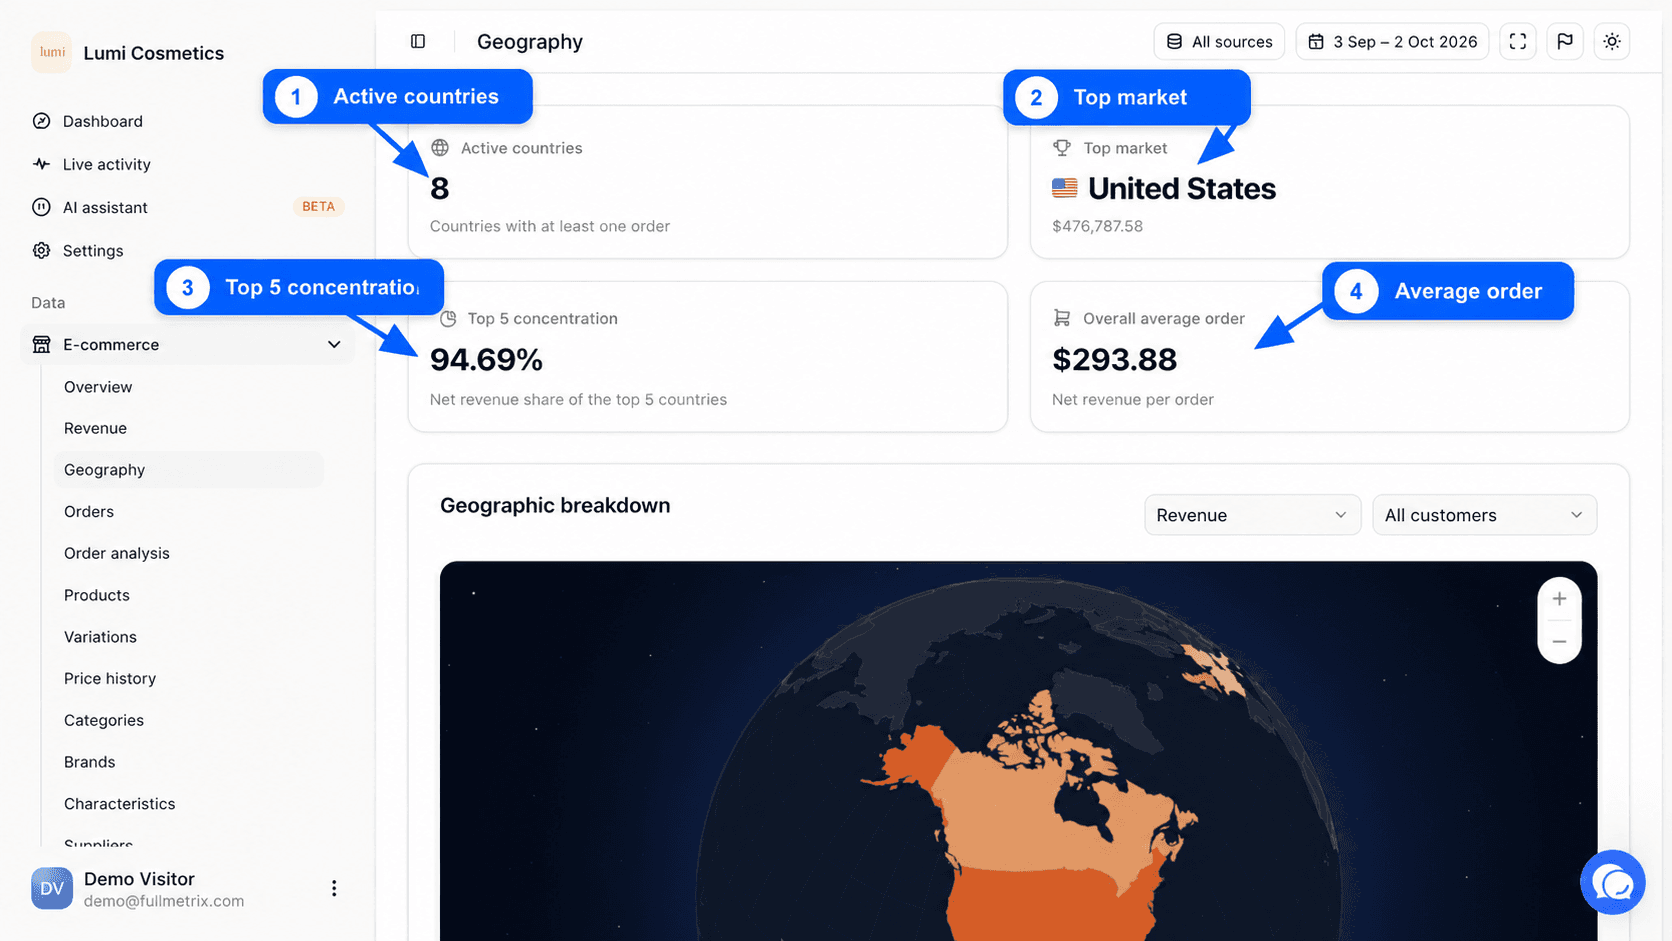
| Active countries | The number of countries with at least one counted order in the period. |
| Top market | The country with the highest revenue, with its flag. Its revenue appears under the name. |
| Top 5 concentration | The share of revenue made by your top five countries. At 95%, you depend almost entirely on five markets. |
| Overall average order | The revenue of all countries divided by their total number of orders. |
These cards follow the choice made in the customer type menu described below. They don't compare with another period.
The Geographic breakdown map
The Geographic breakdown map colors each country by its value. The darker the color, the higher the value. The Low to High legend at the bottom left reminds you which metric is shown. Countries without sales stay neutral.
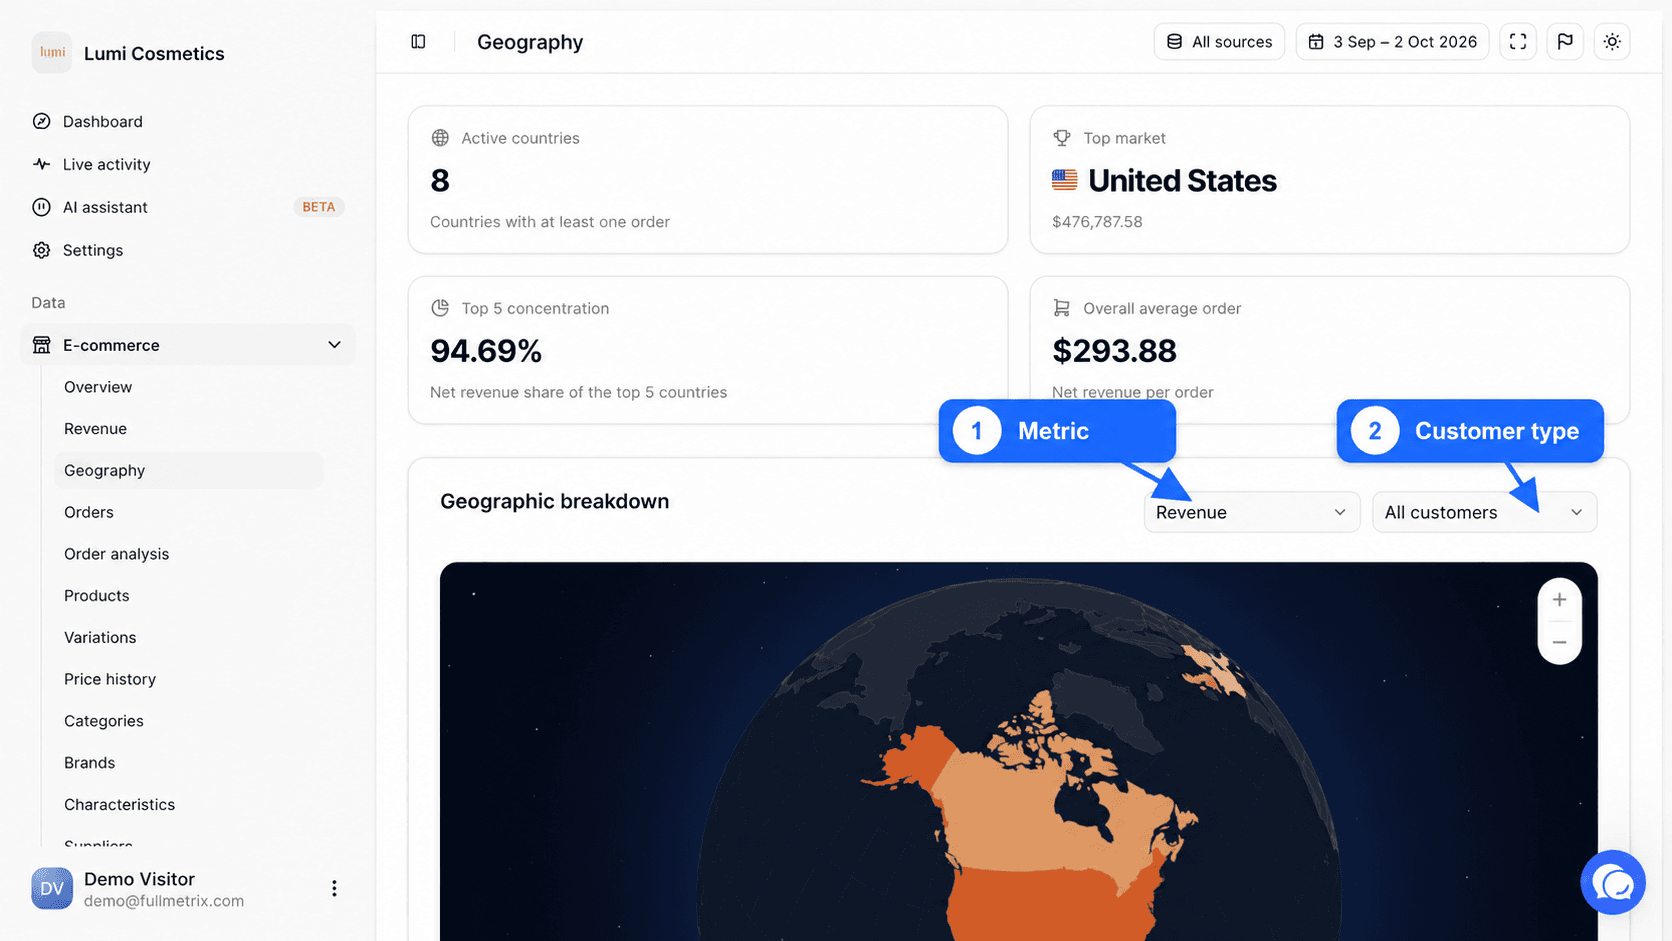
Two menus at the top right of the map change what it shows.
The first menu picks the metric. It also drives the ranking and the Trend column of the table.
| Choice | Value shown per country |
|---|---|
| Revenue | The country's revenue. This is the default. |
| Orders | The country's number of counted orders. |
| Average order value | The country's revenue divided by its orders. |
| Customers | The number of different customers, recognized by their email address, who ordered from that country. |
The second menu picks the customers included, for the whole page.
| Choice | Orders kept |
|---|---|
| All customers | Every counted order, including orders without an email address. This is the default. |
| New customers | Orders from customers whose first counted order falls within the chosen period. |
| Returning customers | Orders from customers who had already ordered before the period. |
With New customers or Returning customers, orders without an email address are left out, because we can't tell whether the customer is new.
Move around the map
Hover a country to show a bubble with its value, its Share of total and its number of Orders. Drag the map to move it. Use the plus and minus buttons at the top right, or your mouse wheel, to zoom.
See a country's regions
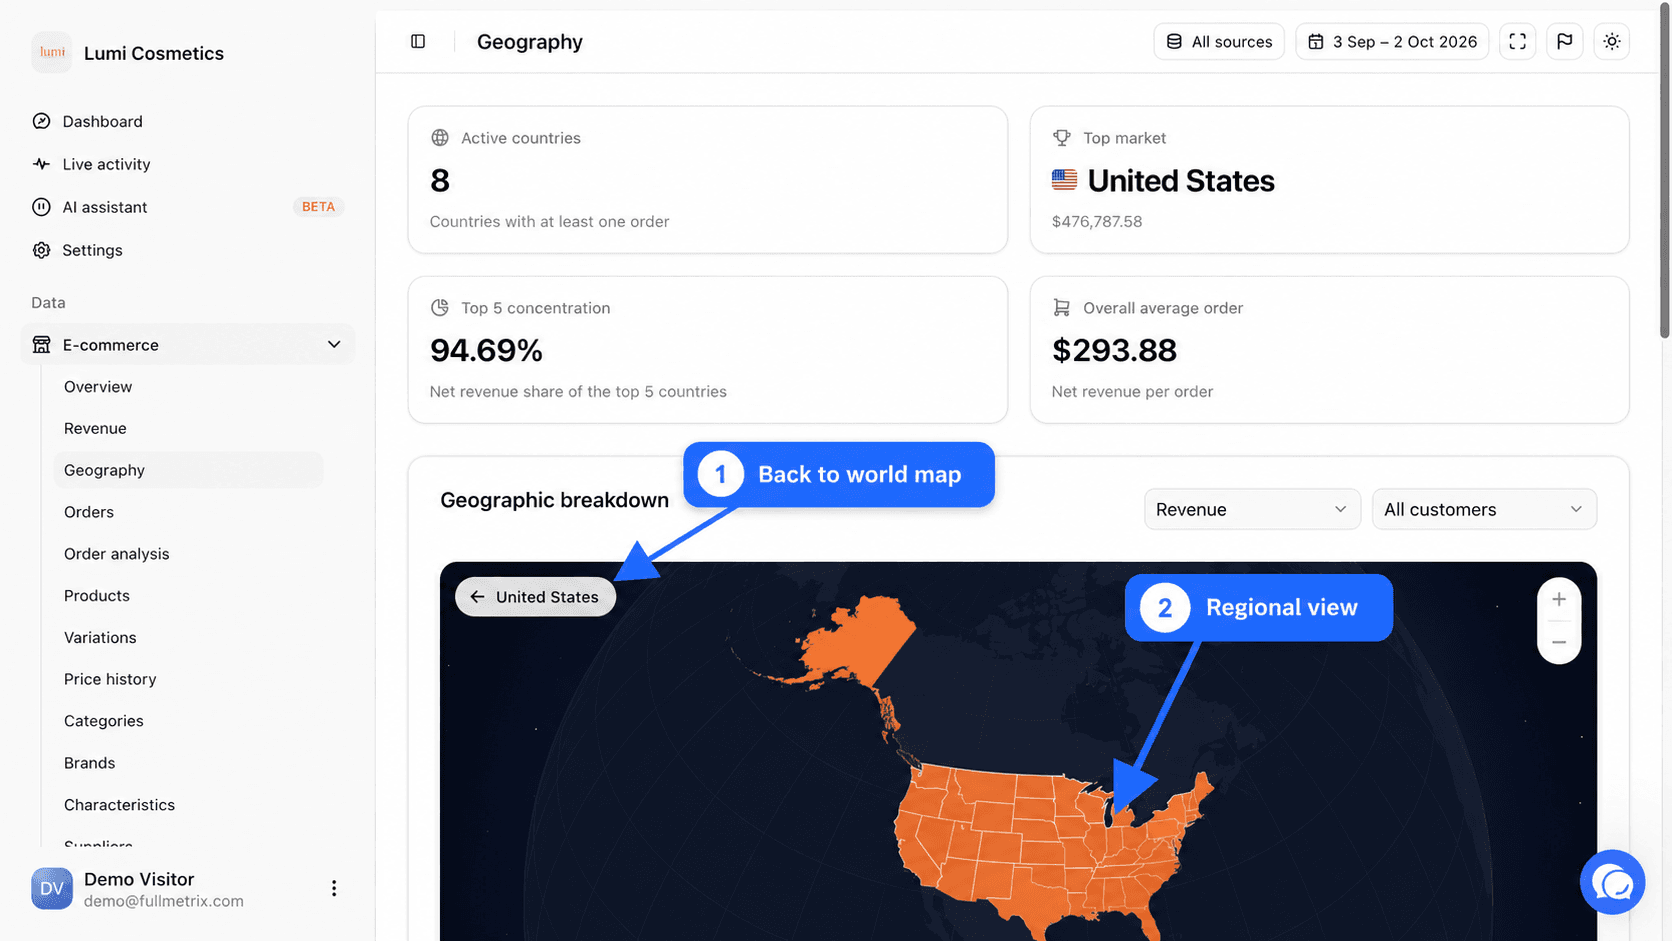
When a country's bubble shows Click to view regions, click the country. The map zooms in and splits it into regions, colored with the same metric.
We work out the region from the region or postal code of the billing address. A country is only clickable if we could place at least 60% of its orders. Otherwise, the map shows Regional data unavailable.
To go back to the world map, click the button with the country's name at the top left of the map.
The country ranking
To the right of the map, the Country ranking lists your countries from strongest to weakest for the chosen metric. Each row shows the rank, the flag, the name, the value and a proportional bar. The percentage to the right of the bar is the country's share of that metric's total.
Hover a row to highlight the country on the map and in the table. Click a row to open the country's regions on the map directly, when they are available.
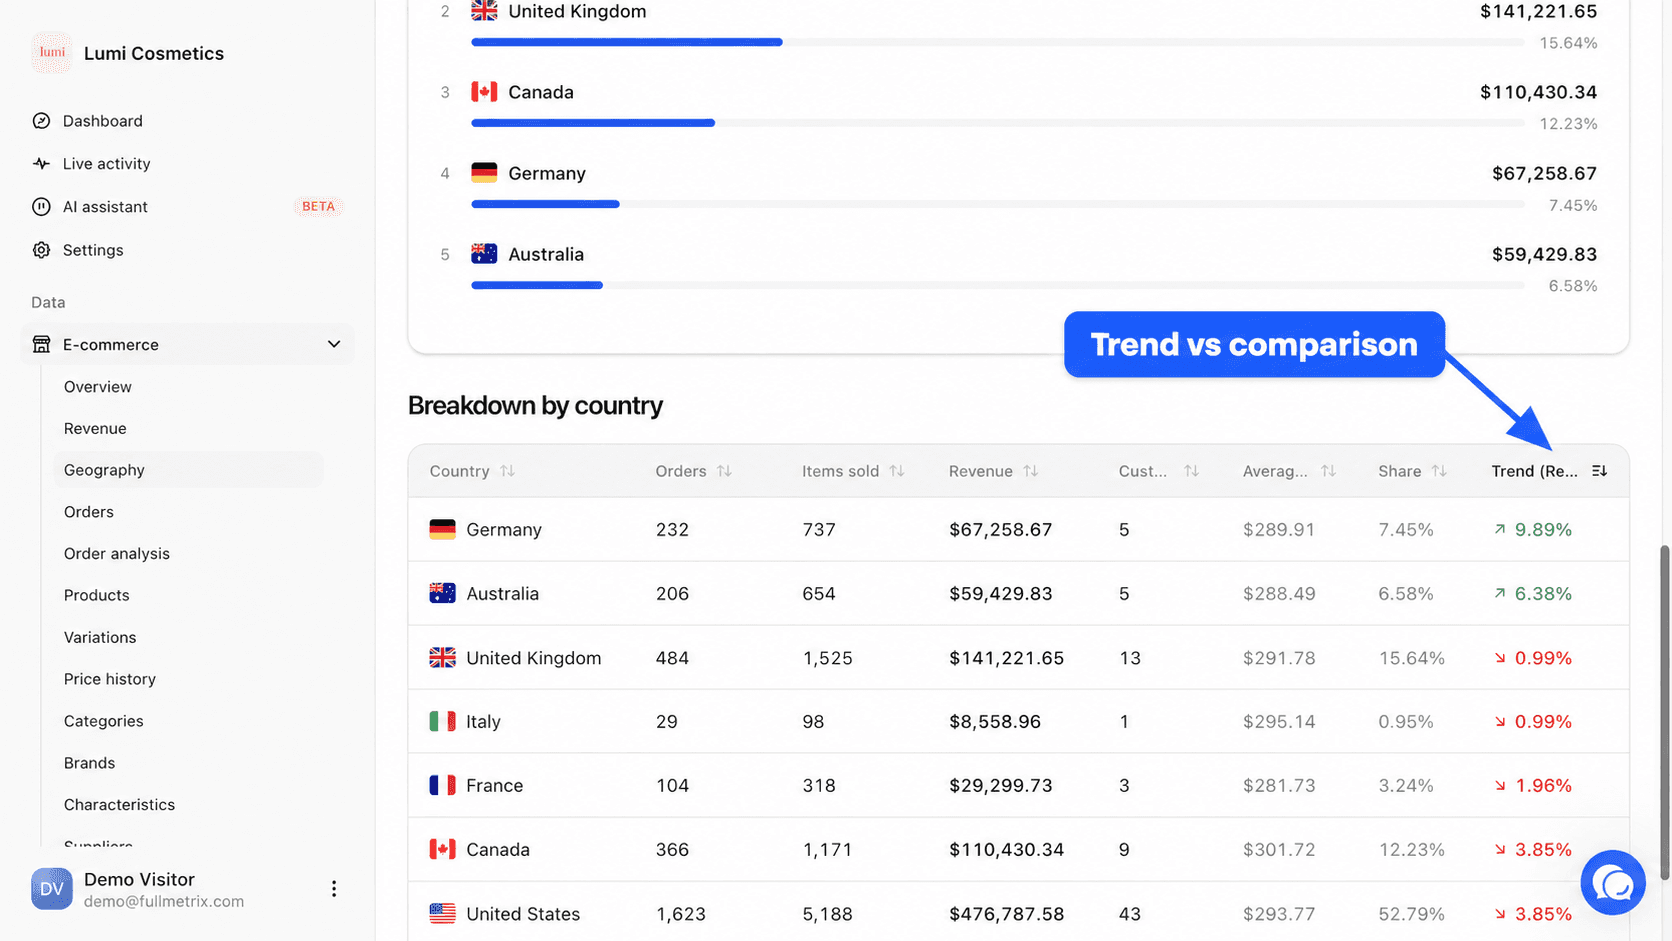
The Breakdown by country table
Below the map, the Breakdown by country table gives every figure for each country.
| Column | Content |
|---|---|
| Country | The country's flag and name |
| Orders | The number of counted orders |
| Items sold | The quantity of items in those orders |
| Revenue | The country's revenue, refunds deducted |
| Customers | The number of different customers recognized by their email |
| Average order value | Revenue divided by orders |
| Share | The country's share of the page's total revenue |
| Trend | The change between the period and the comparison period, for the metric chosen in the map menu |
The last column's title reminds you of the metric, for example Trend (Revenue). A green up arrow is an increase, a red down arrow a decrease. A dash means the country had no value in the comparison period, or that the change is zero.
The table is sorted by revenue, highest first. Click a header to sort by that column, then click again to reverse the order. The Total row at the bottom adds up orders, items and revenue. It doesn't add up customers, because the same customer can order from two countries.
Example questions
- Which countries brought in the most this quarter? Keep Revenue and read the ranking.
- Do my Swiss customers spend more per order than my French customers? Choose Average order value and compare the two rows of the table.
- Where did I recruit my new customers this month? Choose New customers then Customers.
- Which country dropped the most since last year? Sort the table by Trend, lowest first.
- Which regions of France should my ads focus on? Click France to see its regions.
Frequently asked questions
Going further
- Revenue for revenue broken down by period.
- Customer analysis to group your customers by billing or shipping country.
- Customers to see who buys in a given country.