Forecasts
Project your sales, orders and new customers over the next 12 months from your history, and understand how the projection is calculated.
The Forecasts report estimates what you will sell over the next 12 months. It starts from your monthly history, draws the trend and, when the history is long enough, takes your store's seasonality into account. It projects three figures, sales, number of orders and number of new customers.
Use it to prepare a budget, plan stock purchases or set a realistic goal for the year. A forecast remains an estimate. It extends the past and knows nothing about your future promotions or outside events.
Before you start
You need a connected store whose historical import is finished. The longer the history, the more reliable the forecast. With at least 12 months of data, seasonality is taken into account.
Open the report
Expand the E-commerce section
In the left sidebar, in the Data group, click E-commerce.
Choose Forecasts
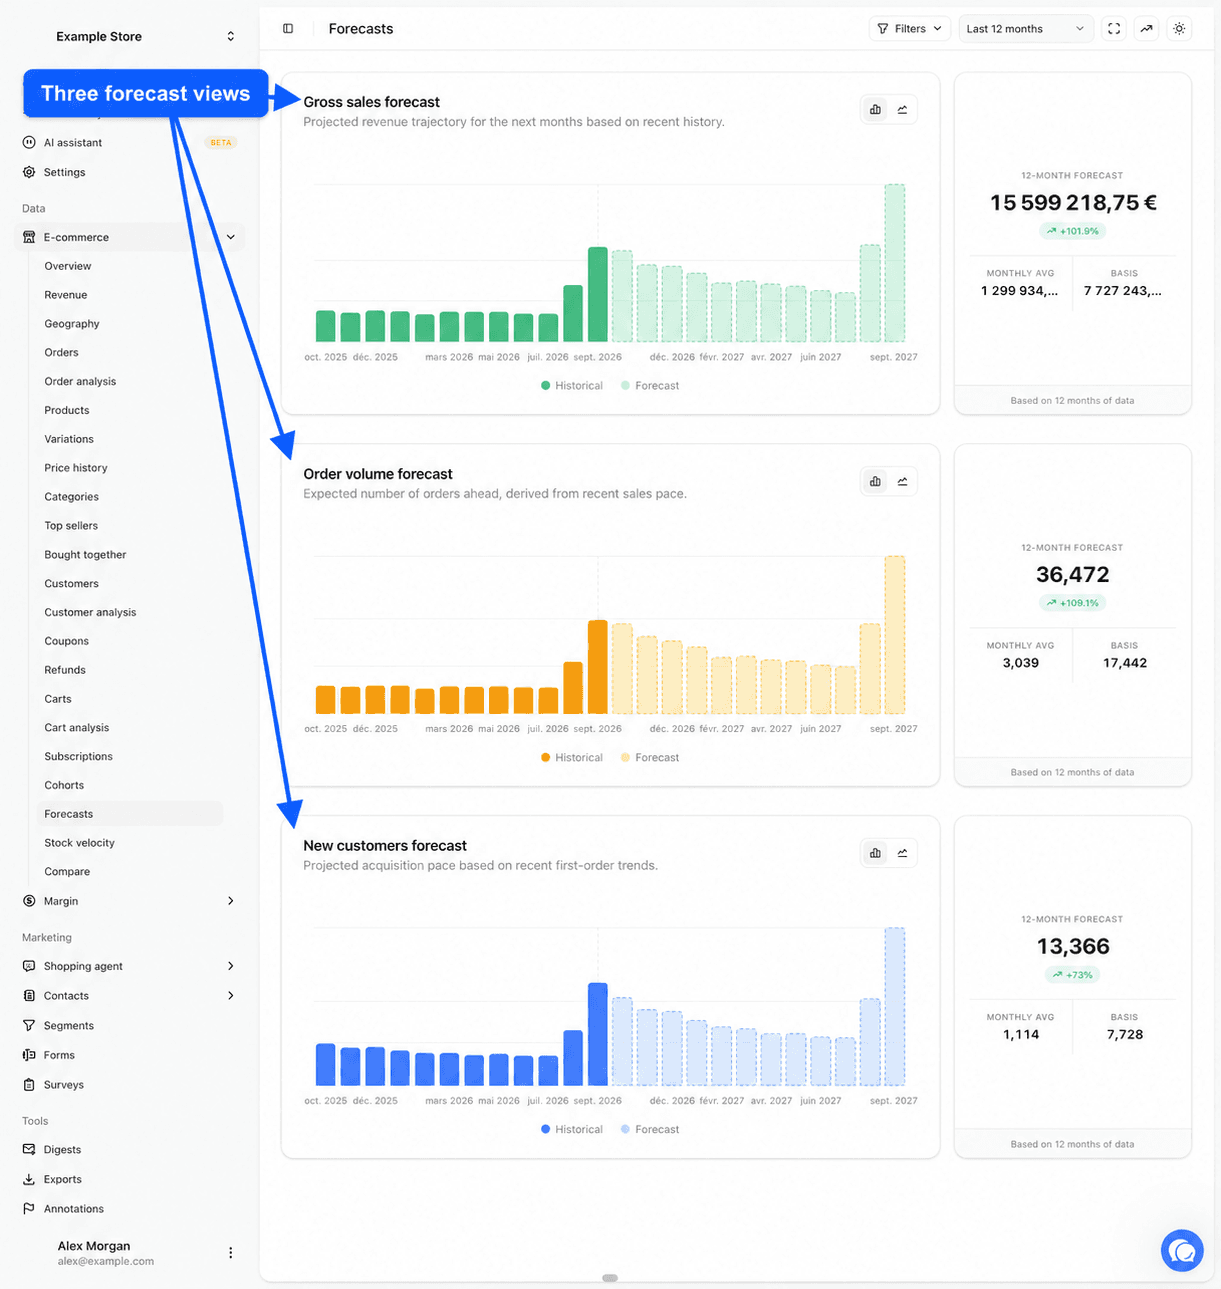
Click Forecasts, near the bottom of the list. Three blocks appear, one per projected figure.
Choose the reference history
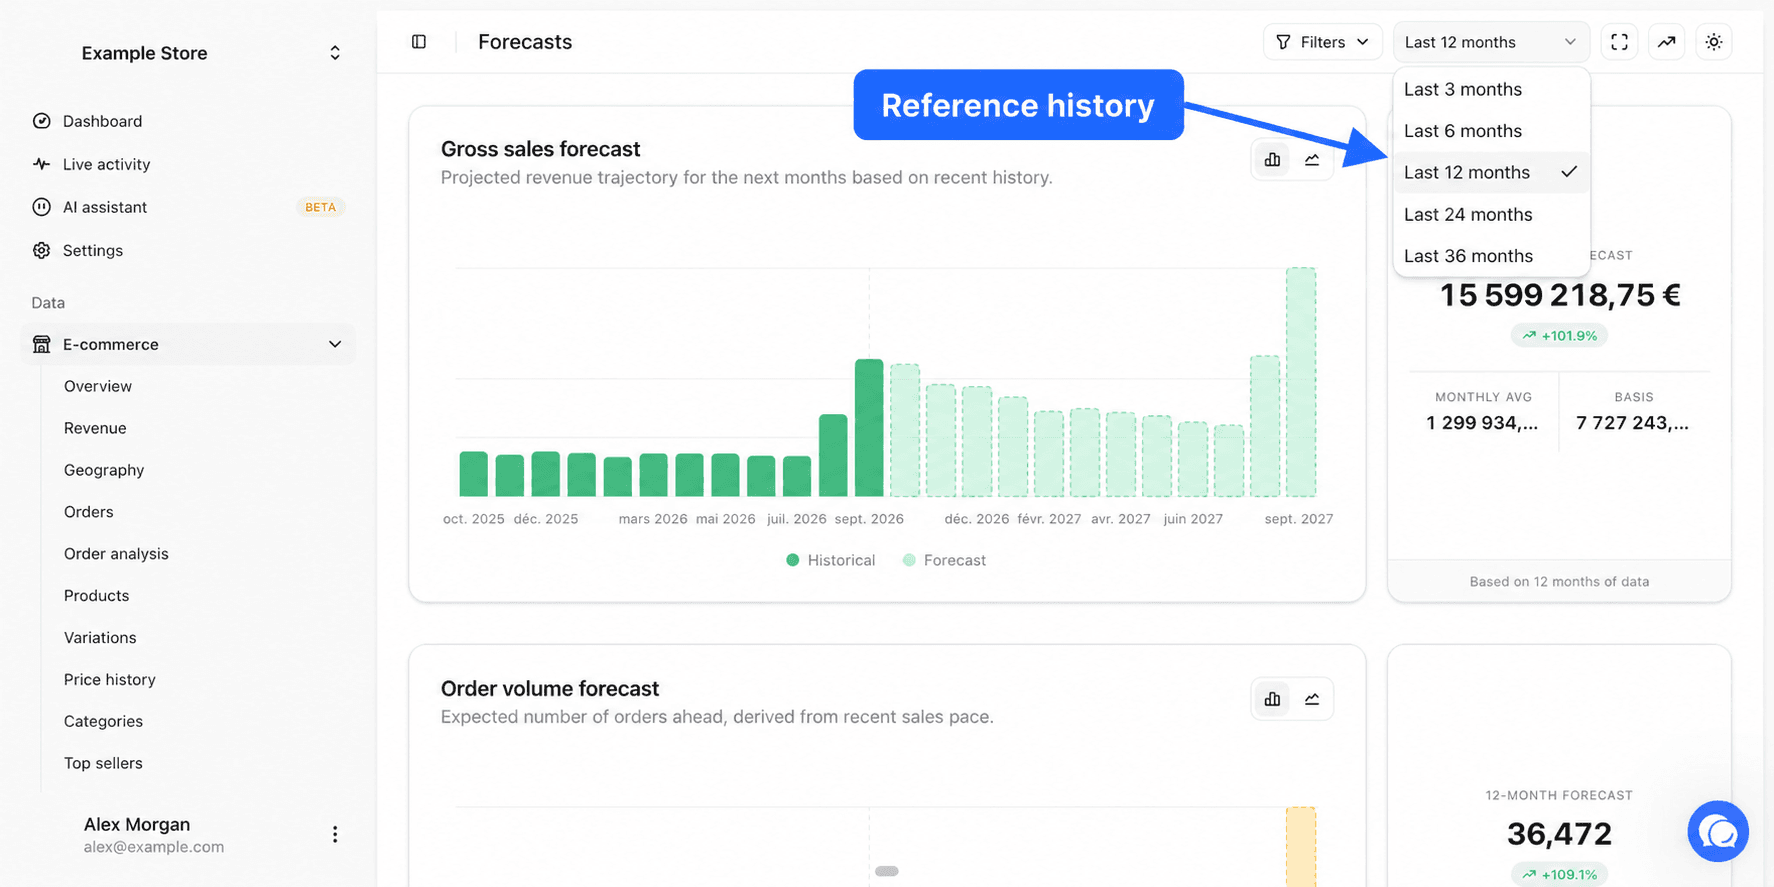
At the top right, a menu picks how many past months are used to compute the forecast. The choices are Last 3 months, Last 6 months, Last 12 months, Last 24 months and Last 36 months. The default is Last 12 months.
We only use complete months. The current month is therefore always ignored, and the forecast starts the following month.
The choice changes the result.
- A short history, such as Last 3 months, closely follows your recent pace. It reacts quickly to a rise or a drop, but it ignores seasonality.
- A history of at least 12 months lets us spot your strong and weak months, for example a December peak, and repeat them in the forecast.
- A very long history, such as Last 36 months, smooths out variations, but it gives an old year as much weight as the recent one.
If your store has less history than the chosen length, we use the months available. The Based on X months of data note, at the bottom of the summary, shows how many months were actually used.
The All sources selector picks the stores included and the Filters button limits the forecast to part of your orders, for example one country. See Choosing stores and Filters and segments.
How the forecast is calculated
The calculation runs in three steps, the same way for all three figures.
Each past month's total
We add up the figure for each month of the chosen history. A month without any sale counts as zero.
The trend
We draw the straight line that best follows those months. It tells whether your activity is going up, down or staying flat, and at what pace. We extend that line over the next 12 months.
Seasonality
If the history contains at least 12 months, we measure for each month of the year whether it usually sits above or below the trend. For example, if your December beats the trend by 40% on average, the forecast December beats it by 40% too. With fewer than 12 months, the forecast follows the trend alone.
A forecast never goes below zero.
The three blocks
Each block contains a chart on the left and a summary on the right.
| Block | Figure for each month |
|---|---|
| Gross sales forecast | The amount of the month's counted orders, after your tax, shipping and fee deductions, minus refunds granted that month. This is the same definition as revenue in the Revenue report. |
| Order volume forecast | The month's number of counted orders. |
| New customers forecast | The number of customers, recognized by their email address, whose very first counted order falls in the month. |
A counted order follows the same rule as in every report. See the E-commerce page and Report settings.
The chart
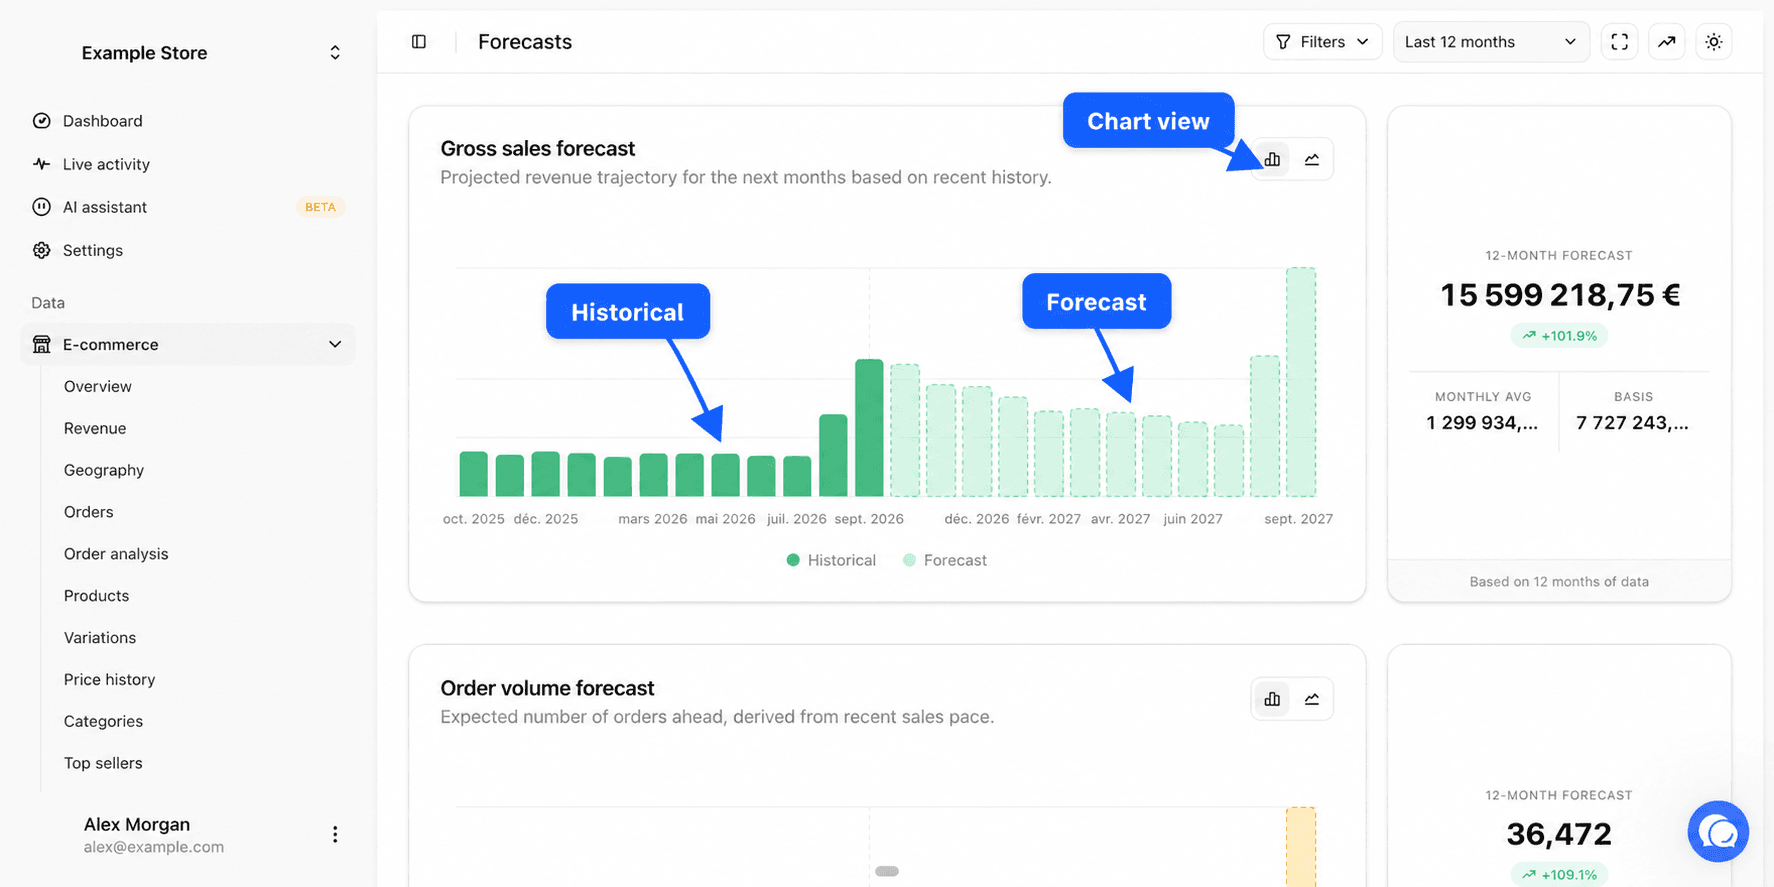
The chart shows the history months in solid color under the Historical legend, then the 12 forecast months in a lighter color under the Forecast legend. The two buttons at the top right of the block switch between a bar chart and a line chart. Hover a month to read its value.
The summary
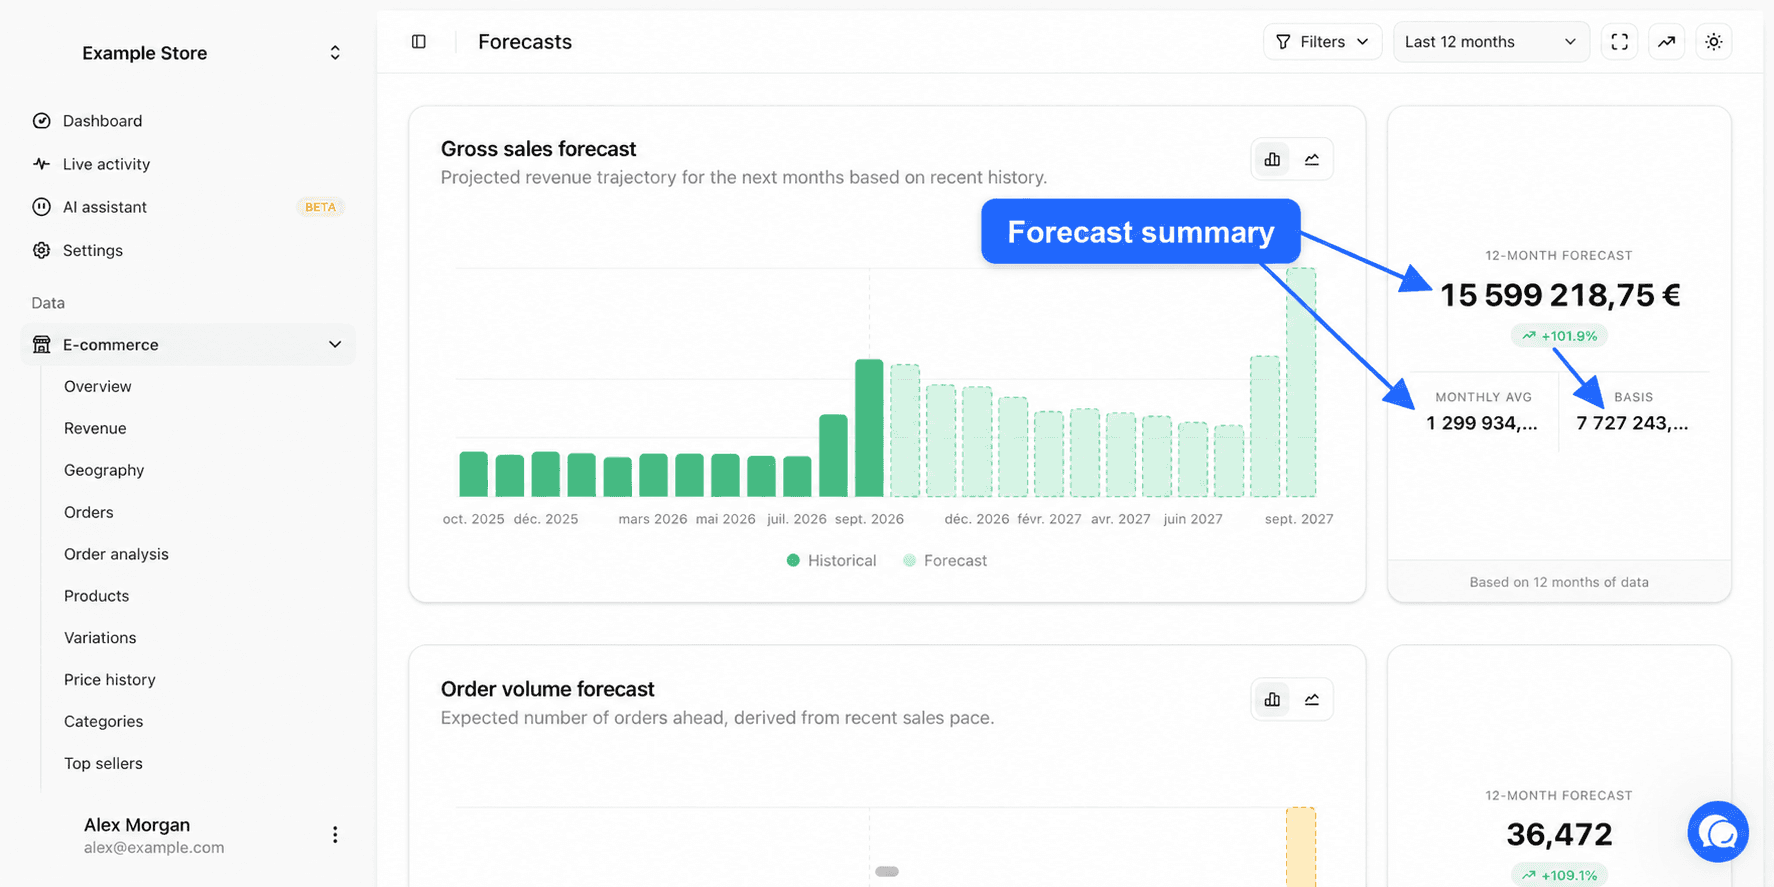
| Item | Meaning |
|---|---|
| 12-month forecast | The total forecast over the next 12 months |
| Green or red percentage | The gap between that forecast total and your history's pace scaled to 12 months |
| Monthly avg | The forecast total divided by 12 |
| Basis | The actual total of the history months used |
| Based on X months of data | The number of months actually used |
Here is an example. With Last 6 months and 60,000 in sales over those six months, your yearly pace is 120,000. If the 12-month forecast shows 132,000, the percentage reads +10%.
Example questions
- How much can I expect to sell next year if I keep my current pace? Read the 12-month forecast of the first block.
- Which month should I prepare first? Choose at least Last 12 months and spot the highest month of the forecast.
- How many new customers will I recruit if nothing changes? Read the third block.
- Is my activity speeding up? Compare the forecast with Last 3 months and with Last 12 months. If the first is higher, your recent pace beats your yearly average.