Cohorts
Understand what a cohort is, measure how many new customers come back to buy and follow their value month after month.
The Cohorts report measures how loyal your customers are. It answers a question revenue alone cannot. Out of the people who bought for the first time in January, how many came back in February, in March, six months later?
What a cohort is
A cohort is a group of customers who placed their first order in the same month (or the same week). Every customer whose first order dates from January 2026 belongs to the January 2026 cohort. Those who started in February form the next cohort, and so on.
Each group is then followed over time. M1 is the first month after the month they arrived, M2 the second, and so on. The arrival month itself is called M0. It has no column, because every customer buys in it by definition.
A worked example
Take a fictional store. In January, 200 people place their first order. They form the January cohort, and together they spend €12,000 that month.
| Month | January customers who order that month | Retention | Revenue that month | Cumulative LTV |
|---|---|---|---|---|
| January (M0) | 200 | no column | €12,000 | €60 |
| February (M1) | 30 | 15% | €2,400 | €72 |
| March (M2) | 20 | 10% | €1,600 | €80 |
| April (M3) | 18 | 9% | €1,400 | €87 |
February retention reads like this. 30 customers out of 200 ordered again, which is 15%. Cumulative LTV is everything the cohort has spent since it arrived, divided by its 200 customers. By the end of February, the cohort has spent 12,000 + 2,400 = €14,400, or €72 per customer.
If your March cohort drops to 8% in M1 while January was at 15%, something changed for the customers who arrived in March. A promotion that attracted one-time buyers, or a weaker entry product, for example.
Open the report
In the sidebar, open Data, then E-commerce, then click Cohorts.
Choose the period and the stores
At the top right, the date range picker chooses which cohorts are shown. It filters on the first order date. With a January to June period, you see the six cohorts from January to June, and each one is followed up to today, even beyond June.
By default, the period covers the last 12 months up to yesterday. It belongs to this report only and does not change the period of other reports. The All sources selector next to it limits the calculation to some stores. See Date range and comparison and Choose the stores you see.
The table settings
Above the Cohort analysis table, a sentence sums up the content, for example "2,400 customers across 12 cohorts". The settings sit to its right.
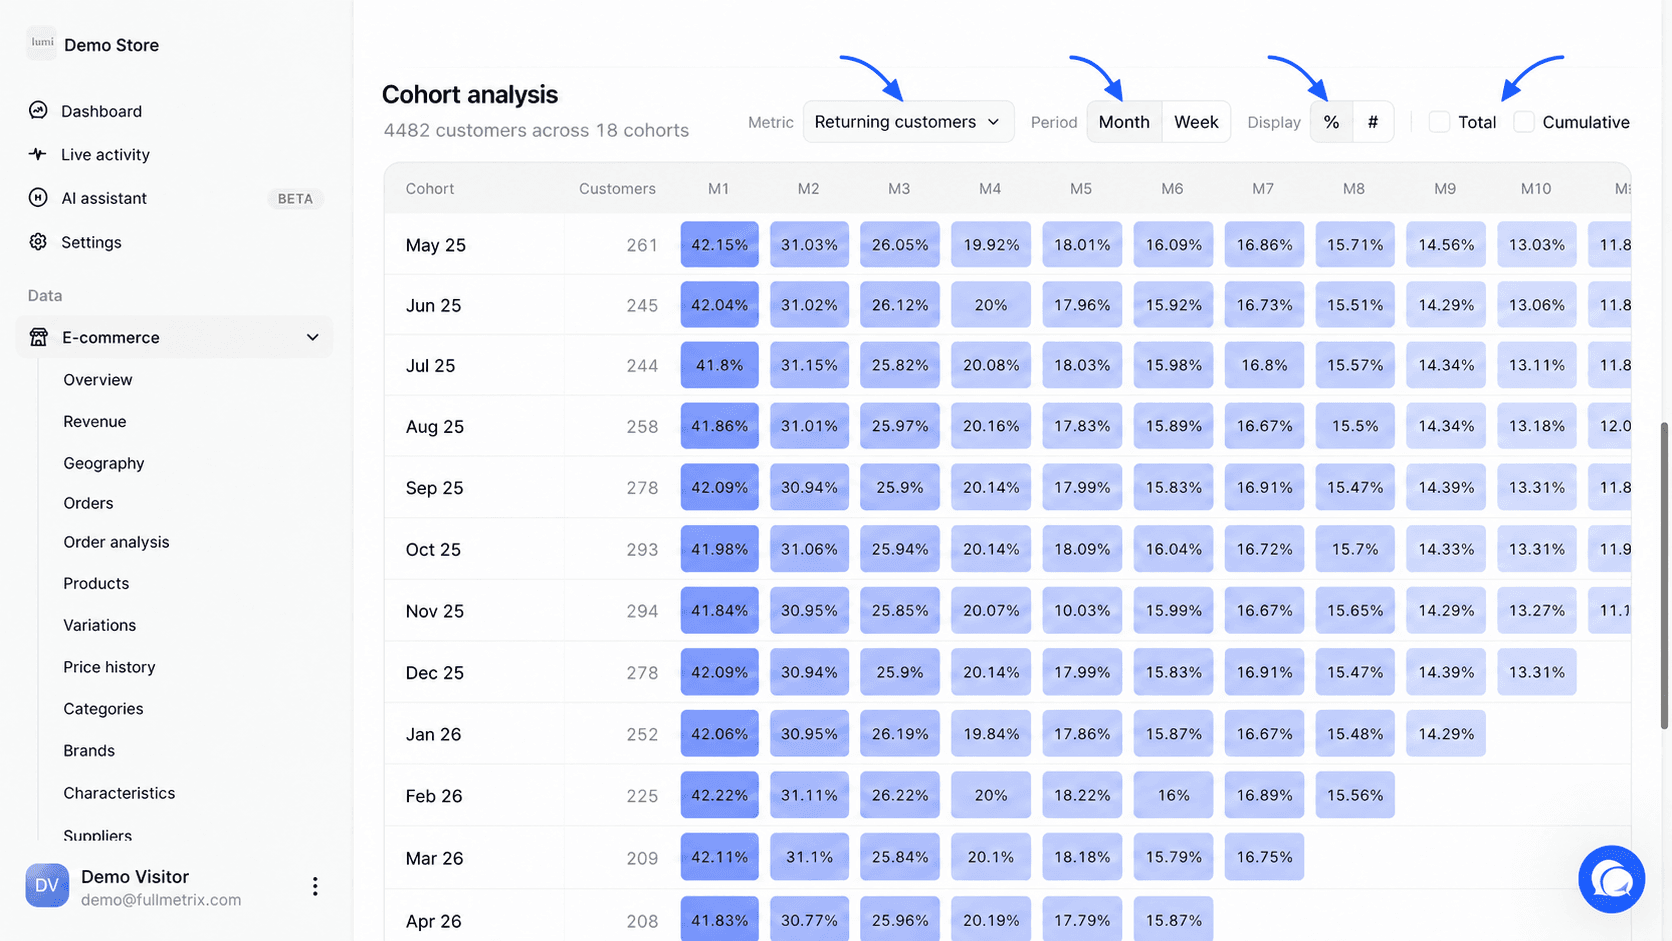
Metric chooses what the cells, the cards and the curve show. The six options are described below.
Period chooses the size of the cohorts. With Month, a cohort covers a calendar month and the table goes up to 18 columns, from M1 to M18. With Week, a cohort covers a week from Monday to Sunday, the columns are called W1, W2, and the table goes up to W26.
Display only appears for the Returning customers metric. The % button shows the retention rate, the # button shows the number of customers.
The Total checkbox adds a column that adds up every period from M1 on. The Cumulative checkbox replaces each cell with the sum from M1 up to that column. For example, with cumulative Orders, the M3 cell gives the total number of orders the cohort placed between M1 and M3.
The metrics
Each metric is computed per cohort and per period. The cohort's "size" is its number of customers, shown in the Customers column.
| Metric | What a cell shows |
|---|---|
| Returning customers | The share of the cohort's customers who placed at least one order during that period. In # mode, their number. Hover a cell to see both, for example "30 / 200". |
| Orders | The number of orders the cohort placed during that period. |
| Revenue | The amount of those orders, as net sales. Taxes, shipping and fees are removed according to your settings, refunds are not. |
| Average order | The period's revenue divided by its number of orders. |
| Orders per customer | The period's number of orders divided by the number of customers who ordered during that period. |
| Customer lifetime value (LTV) | Everything the cohort has spent since its arrival month, M0 included, up to that period, divided by the cohort's size. This metric is always cumulative. |
Counted orders follow your report settings. Excluded statuses and ignored customers are left out, see Report settings. Orders without an email address cannot be tied to a customer and do not enter any cohort.
Read the table
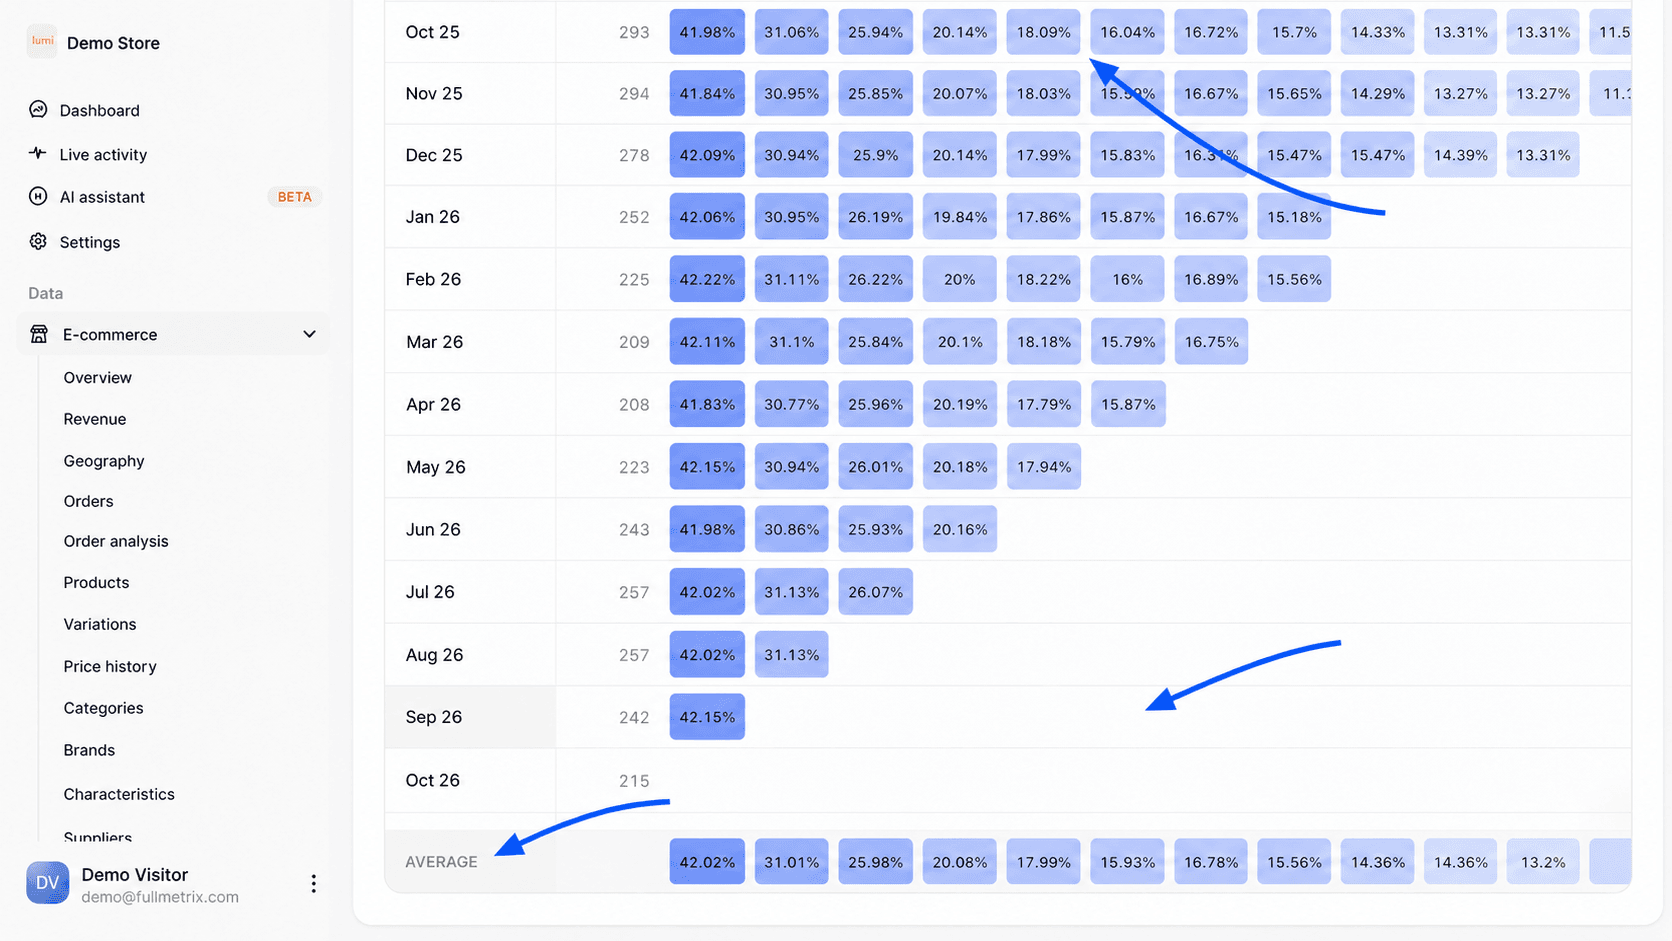
Each row is a cohort, named after its month or after the first day of its week. The Customers column gives its size. The period columns follow. The darker a cell, the higher the value. For retention, the color follows the percentage. For the other metrics, it compares each cell to the highest value in the table.
Empty cells in the bottom right are normal. Last month's cohort has not had time to reach M6 yet.
The last row, Average, gives for each period the average of the cohorts, weighted by their size. A cohort of 500 customers weighs more than a cohort of 50. Only cohorts that have already reached the period count. For Returning customers, Orders and Revenue, a cohort that bought nothing during a period counts as zero in the average.
The cards and the curve
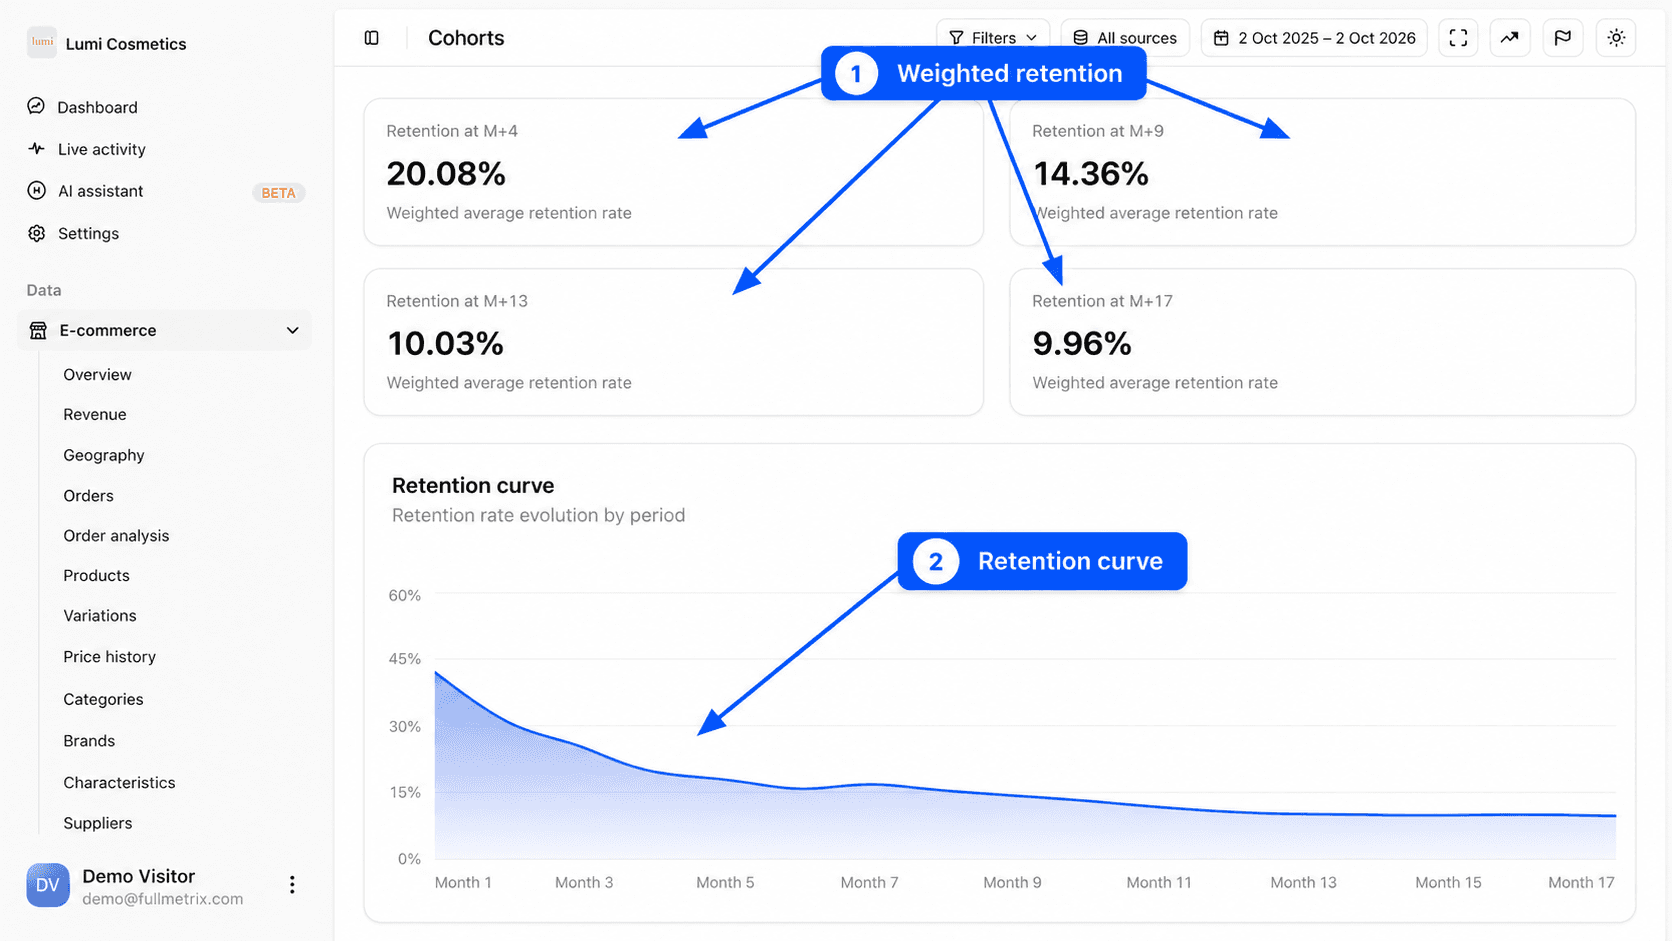
The four cards at the top of the page show the Average row at four points spread over the length of the table. With 12 months of history, you read for example Retention at M+3, Retention at M+6, Retention at M+9 and Retention at M+12, each with the note Weighted average retention rate. The card titles follow the chosen metric.
The curve under the cards plots this same average period after period. Its title also follows the metric, for example Retention curve or LTV curve. A retention curve that levels off after a few months shows a core of loyal customers. An LTV curve that keeps rising shows that your customers keep bringing in money long after their first purchase.
Filter the customers you study
The Filters and Load a segment buttons limit the calculation to a group of customers. You can, for example, follow only customers from one country, those who bought a given category or those who arrived with a coupon code. The fields are the same as in the Customers report. See Filters and segments.
Example questions
- What share of my new customers buy again within three months? Read the Retention at M+3 card on the Returning customers metric.
- How much is a new customer worth after a year? Choose Customer lifetime value (LTV) and read the M12 column of the Average row. Compare it with what it costs you to acquire a customer.
- Are customers who arrived during the sales less loyal? Compare the January or July cohort row with the rows around it.
- Do customers who arrived with a coupon code come back as much as the others? Filter on Coupon code used and compare with the unfiltered table.
Frequently asked questions
To find out which entry products bring the most loyal customers, pair this report with Customer analysis.