Cart analysis
Track your cart abandon rate and conversion rate day by day, and spot the products visitors leave behind in their cart.
The Cart analysis report sums up what happened in your store's carts over the period. How many were started, how many were abandoned, how many became orders, and which products were most added, most abandoned and most bought. Where the Carts report shows each cart one by one, this one gives you the big picture.
Open the report
In the sidebar, open E-commerce in the Data group, then click Cart analysis. The entry is always visible once a store is connected.
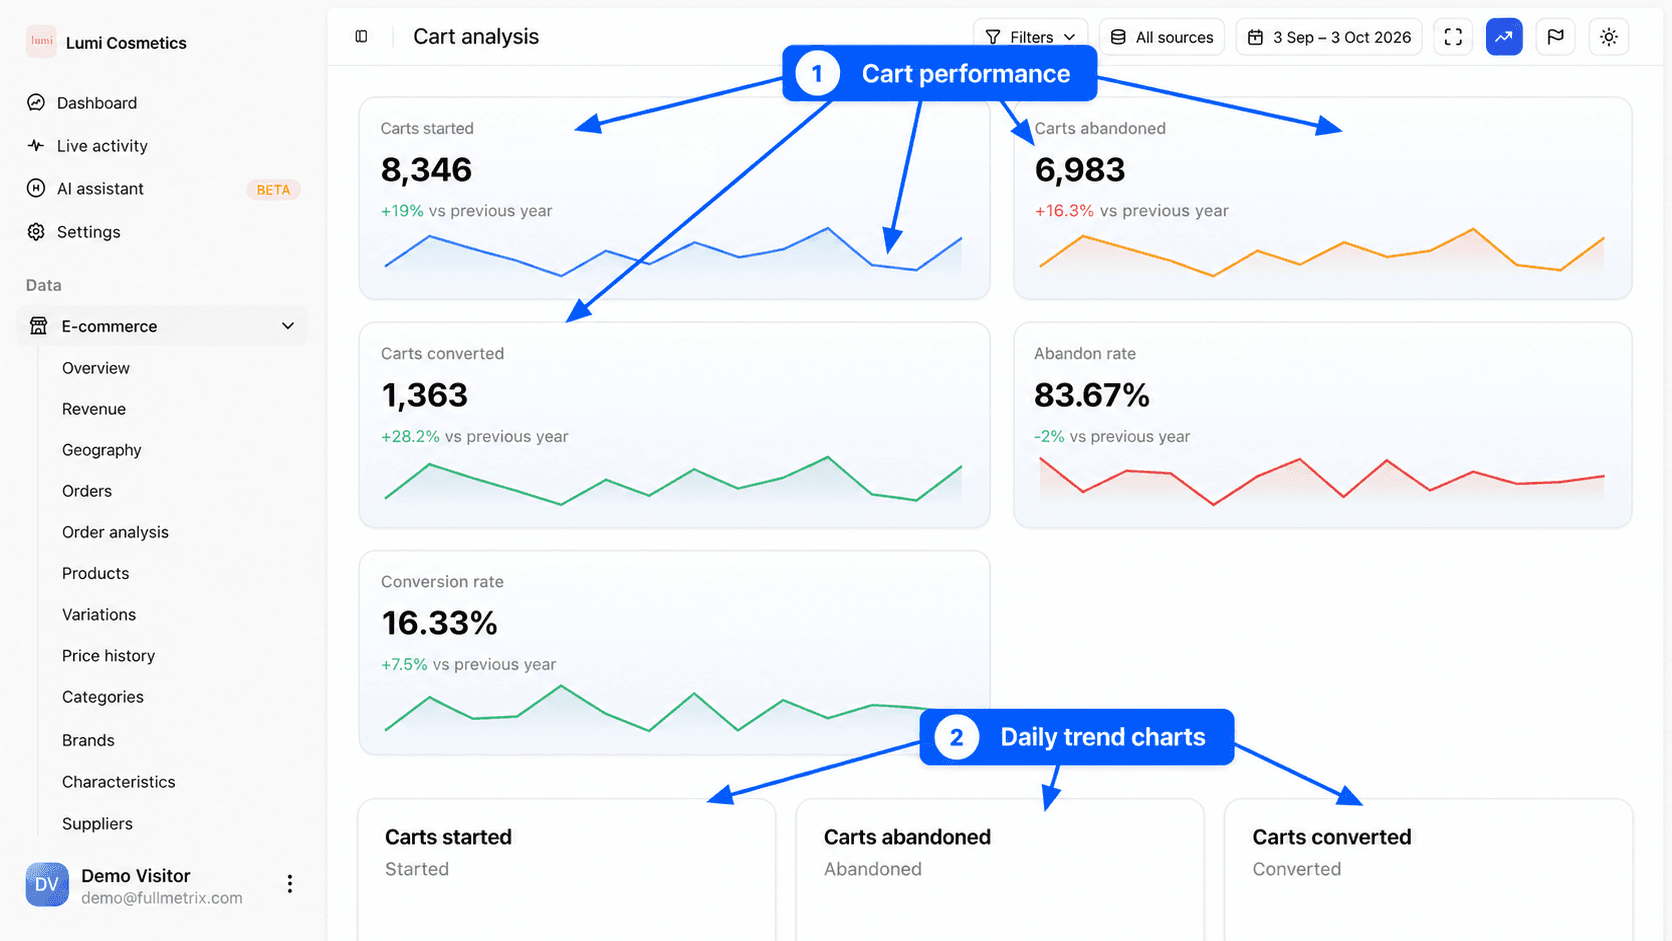
At the top right, All sources picks the stores and the date picker sets the period. Carts are counted on the date they were created. With the default period (the last 30 days), the report also includes today's carts.
What this report is for
- What is our cart abandon rate, and is it going down?
- How many carts turn into an order?
- Which products do visitors add and then drop?
- Did the change in our shipping fees push abandonments up?
- Which day had the most abandoned carts?
The five metrics
| Metric | Definition |
|---|---|
| Carts started | The number of carts created over the period. |
| Carts abandoned | Of those, the ones that were not converted and have not changed for more than an hour, or that your store marked as abandoned. |
| Carts converted | Of those, the ones that became an order. |
| Abandon rate | Carts abandoned divided by carts started, as a percentage. |
| Conversion rate | Carts converted divided by carts started, as a percentage. |
For example, 1,000 carts were started over the period, 700 were abandoned and 250 converted. The abandon rate is 70% and the conversion rate 25%. The remaining 50 carts are still open, meaning they changed less than an hour ago.
Each card shows a small curve of the last 14 days of the period and the change compared with the comparison period set in the date picker (previous period or same period last year).
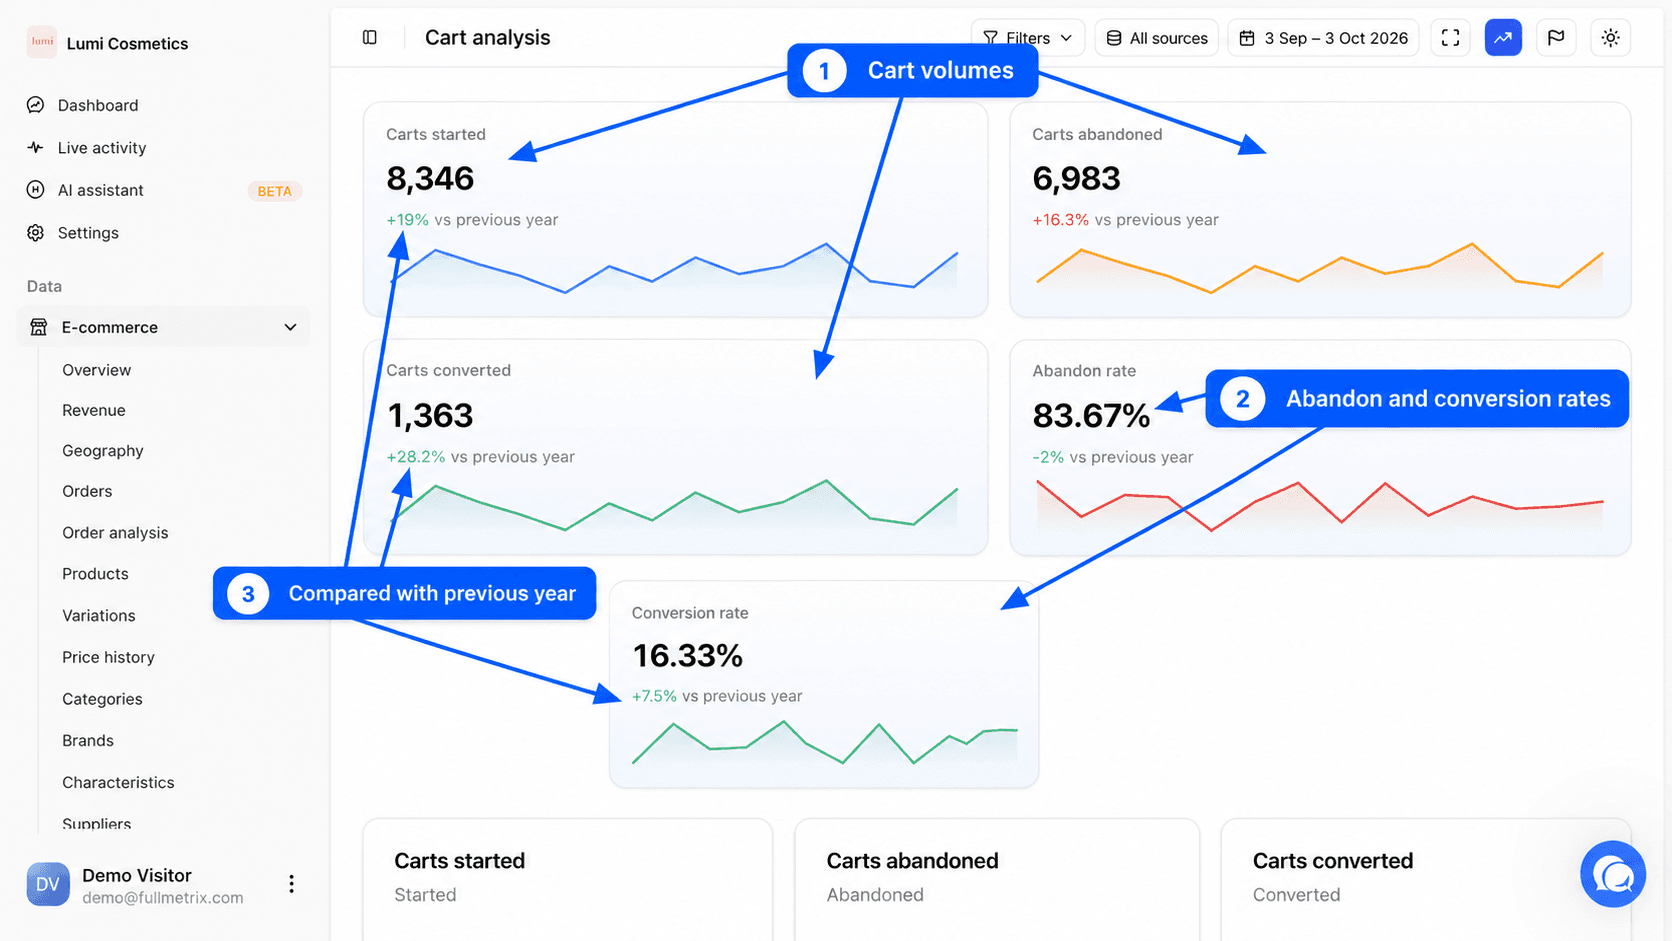
Carts from customers ignored in Settings, Reports tab, are not counted.
The three charts
- Carts started plots the number of carts created each day.
- Carts abandoned plots, for each day, how many carts created that day were abandoned.
- Carts converted plots, for each day, how many carts created that day were converted.
A spike in carts started with no rise in carts converted often points to a payment problem or a campaign that brings undecided visitors.
Most added, abandoned and converted products
Three cards rank the 10 products with the most units in the period's carts.
| Card | What it ranks |
|---|---|
| Most added | all carts, whatever their outcome |
| Most abandoned | abandoned carts only |
| Most converted | converted carts only |
Each row shows the number of units (for example "84 added") and the number of carts that held the product (for example "61 carts"). Clicking a product opens its page.
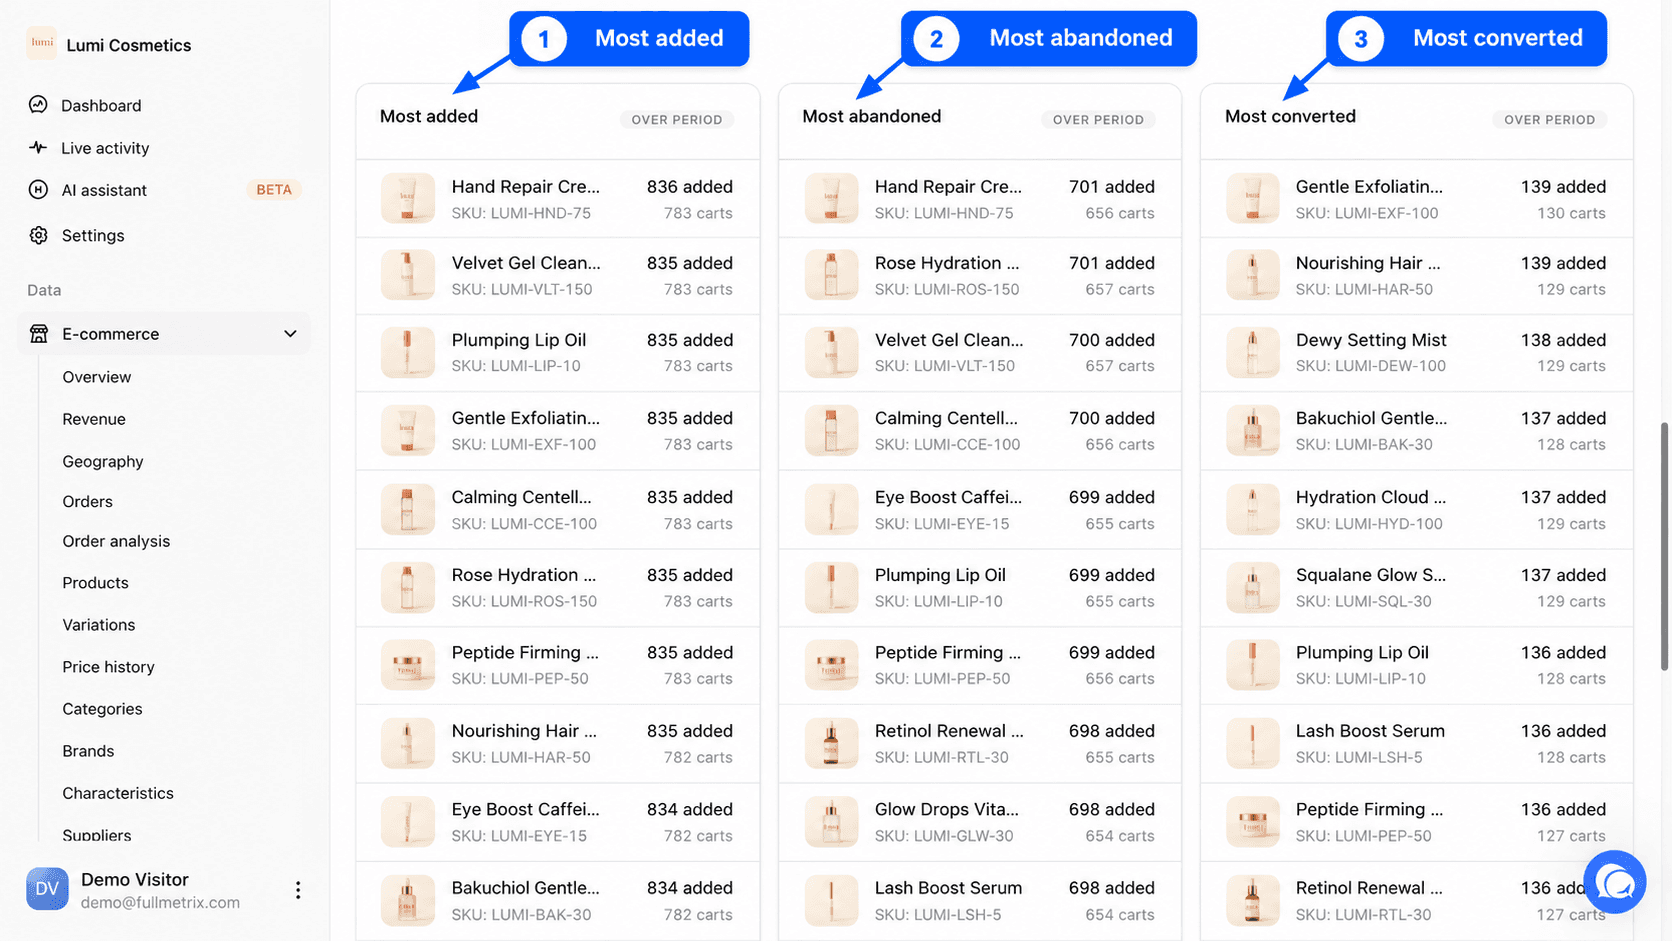
A product near the top of the most abandoned list but not the most converted one deserves a closer look. Its price, shipping fees, delivery time or product page may be holding buyers back.
The daily breakdown
The Daily breakdown table lists each day of the period.
| Column | What it shows |
|---|---|
| Date | The day the carts were created. |
| Started | The carts created that day. |
| Abandoned | The ones that were abandoned, in orange. |
| Converted | The ones that were converted, in green. |
| Total value | The combined amount of all carts created that day. |
| Converted revenue | The combined amount of converted carts. |
Every column can be sorted. By default, the most recent days are at the top. The Total row adds up the period.
Converted revenue is the cart amount at the time of conversion. It can differ from order revenue, which follows your reporting settings. For revenue, see Revenue.
Filter the carts analyzed
The filter bar at the top of the page keeps only the carts that meet your conditions. It accepts the fields of the Carts report, for example Country, Existing customer, Has coupons, Product in cart or UTM Source. For instance, filter on Existing customer equals yes to compare the abandon rate of your loyal customers with that of new visitors. See Filters and segments.
Differences by platform
On Shopify, we only receive started checkouts, not carts filled and then emptied before payment. Volumes are lower and the abandon rate mostly measures abandonment during payment. On PrestaShop, WooCommerce, Magento and Sylius, carts are tracked from the first product added. Avoid comparing the abandon rate of a Shopify store with that of a store on another platform.
If the page is empty
If the cards show 0, no cart was created over the period in the chosen stores. Widen the period, check All sources and remove any filters. The product cards show No products when no cart holds a product in the category concerned.