Your first report
Use the Revenue report to answer a clear business question and produce a result that someone else can reproduce.
Your first report should answer one question with a clearly recorded scope. This example uses E-commerce > Revenue to explain a change in sales.
1. Write the question first
Use a specific question such as:
How did revenue, orders, items sold, and average order value change this month compared with the selected comparison period?
A question prevents the report from becoming a tour of unrelated metrics.
2. Open the Revenue report
In the sidebar, expand E-commerce and choose Revenue. Select the intended store or stores, apply only the filters needed for the question, and set the completed date range.
Record:
- Organization and selected store sources
- Applied filters or segment
- Current date range and comparison mode
- Currency and organization time zone
3. Read the summary cards
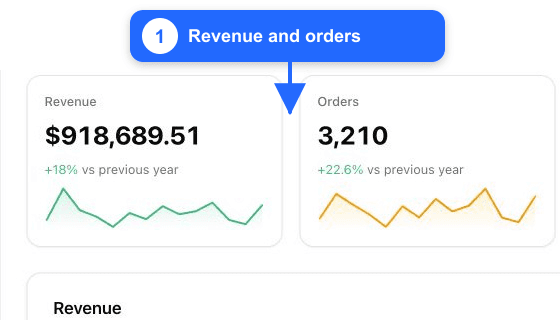
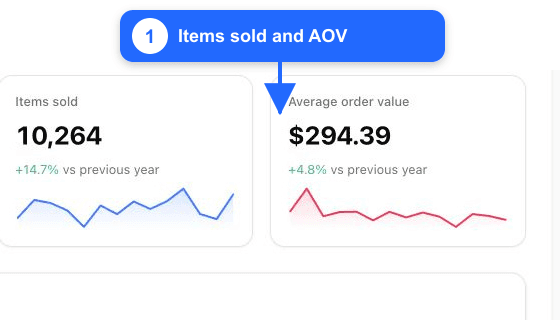
Use the four cards to separate volume from value:
- Revenue measures the amount reported for the selected orders.
- Orders shows transaction volume.
- Items sold shows unit volume.
- Average order value divides revenue by orders.
If revenue increased, determine whether the change came from more orders, more items per order, a higher average order value, or a combination.
4. Inspect the daily trend
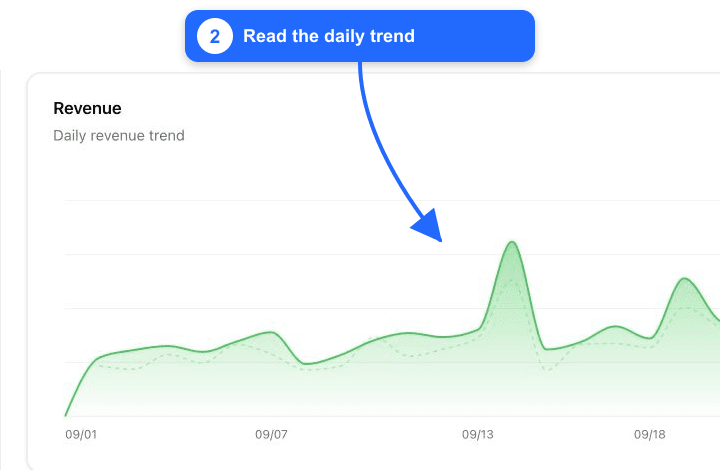
Find the dates that contribute most to the change. Hover the chart for exact values and compare the solid current-period line with the lighter comparison line.
Do not explain a spike from correlation alone. Check campaign, promotion, product, stock, annotation, and incident data for the same date.
5. Use the breakdown
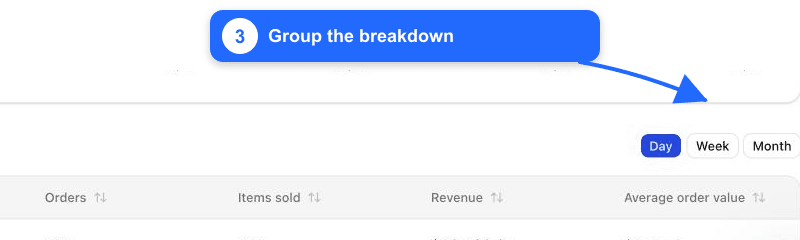
The table below the chart can group results by Day, Week, or Month. Choose the smallest useful level:
- Day for incidents, launches, and short promotions
- Week for recurring trading reviews
- Month for longer-term planning
Sort a column to find the largest contributors. Continue down the page for available breakdowns such as customer type or payment method.
6. Share a reproducible conclusion
Use this structure:
From
[start]to[end],[store scope]generated[revenue]from[orders]orders. Revenue changed by[comparison]. The change was concentrated on[dates]and was mainly associated with[verified driver]. Filters:[filters or none].
Do not publish customer-level data
Share aggregate report values unless a recipient is authorised to view personal data. Remove emails, phone numbers, addresses, order notes, and exported identifiers from screenshots or tickets.
If the numbers look wrong
- Confirm the store scope, filters, date range, time zone, and comparison.
- Check that the historical import is complete and the connection is healthy.
- Compare a small set of completed orders with the commerce platform.
- Review excluded statuses, refunds, taxes, shipping, and currency handling.
- Record the exact mismatch before contacting support.
Next, set up profit tracking so revenue can be evaluated against product and advertising costs.